A fairly generic track object for arbitrary genomic range annotations, with
the option of grouped track items. The extended DetailsAnnotationTrack
provides a more flexible interface to add user-defined custom
information for each range.
# S4 method for class 'AnnotationTrack'
initialize(.Object, ...)

# S4 method for class 'ReferenceAnnotationTrack'
initialize(
  .Object,
  stream,
  reference,
  mapping = list(),
  args = list(),
  defaults = list(),
  ...
)

AnnotationTrack(
  range = NULL,
  start = NULL,
  end = NULL,
  width = NULL,
  feature,
  group,
  id,
  strand,
  chromosome,
  genome,
  stacking = "squish",
  name = "AnnotationTrack",
  fun,
  selectFun,
  importFunction,
  stream = FALSE,
  ...
)

DetailsAnnotationTrack(...)

# S4 method for class 'DetailsAnnotationTrack'
initialize(.Object, fun, selectFun, ...)

# S4 method for class 'AnnotationTrack'
group(GdObject)

# S4 method for class 'AnnotationTrack,character'
group(GdObject) <- value

# S4 method for class 'AnnotationTrack'
identifier(GdObject, type = .dpOrDefault(GdObject, "groupAnnotation", "group"))

# S4 method for class 'AnnotationTrack,character'
identifier(GdObject) <- value

# S4 method for class 'AnnotationTrack'
setStacks(GdObject, recomputeRanges = TRUE)

# S4 method for class 'AnnotationTrack'
consolidateTrack(
  GdObject,
  hasAxis = FALSE,
  hasTitle = .dpOrDefault(GdObject, "showTitle", TRUE),
  title.width = NULL,
  ...
)

# S4 method for class 'AnnotationTrack'
collapseTrack(GdObject, diff = .pxResolution(coord = "x"), xrange)

# S4 method for class 'AnnotationTrack'
subset(
  x,
  from = NULL,
  to = NULL,
  sort = FALSE,
  stacks = FALSE,
  use.defaults = TRUE,
  ...
)

# S4 method for class 'ReferenceAnnotationTrack'
subset(x, from, to, chromosome, ...)

# S4 method for class 'AnnotationTrack'
drawGD(GdObject, minBase, maxBase, prepare = FALSE, subset = TRUE, ...)

# S4 method for class 'DetailsAnnotationTrack'
drawGD(GdObject, minBase, maxBase, prepare = FALSE, ...)

# S4 method for class 'AnnotationTrack'
show(object)

# S4 method for class 'ReferenceAnnotationTrack'
show(object)
Arguments
- ...
Additional items which will all be interpreted as further display parameters. See settings and the "Display Parameters" section below for details.
- stream
A logical flag indicating that the user-provided import function can deal with indexed files and knows how to process the additional
selectionargument when accessing the data on disk. This causes the constructor to return aReferenceAnnotationTrackobject which will grab the necessary data on the fly during each plotting operation.- range
An optional meta argument to handle the different input types. If the
rangeargument is missing, all the relevant information to create the object has to be provided as individual function arguments (see below).The different input options for
rangeare:A
GRangesobject: the genomic ranges for theAnnotationtrack as well as the optional additional metadata columnsfeature,groupandid(see description of the individual function parameters below for details). Calling the constructor on aGRangesobject without further arguments, e.g.AnnotationTrack(range=obj)is equivalent to calling the coerce methodas(obj, "AnnotationTrack").A
GRangesListobject: this is very similar to the previous case, except that the grouping information that is part of the list structure is preserved in theAnnotationTrack. I.e., all the elements within one list item receive the same group id. For consistency, there is also a coercion method fromGRangesListsas(obj,"AnnotationTrack").An
IRangesobject: almost identical to theGRangescase, except that the chromosome and strand information as well as all additional metadata has to be provided in the separatechromosome,strand,feature,grouporidarguments, because it can not be directly encoded in anIRangeobject. Note that none of those inputs are mandatory, and if not provided explicitly the more or less reasonable default valueschromosome=NAandstrand="*"are used.A
data.frameobject: thedata.frameneeds to contain at least the two mandatory columnsstartandendwith the range coordinates. It may also contain achromosomeand astrandcolumn with the chromosome and strand information for each range. If missing it will be drawn from the separatechromosomeorstrandarguments. In addition, thefeature,groupandiddata can be provided as additional columns. The above comments about potential default values also apply here.A
characterscalar: in this case the value of therangeargument is considered to be a file path to an annotation file on disk. A range of file types are supported by theGvizpackage as identified by the file extension. See theimportFunctiondocumentation below for further details.
- start, end, width
Integer vectors, giving the start and the end end coordinates for the individual track items, or their width. Two of the three need to be specified, and have to be of equal length or of length one, in which case this single value will be recycled. Otherwise, the usual R recycling rules for vectors do not apply here.
- feature
Factor (or other vector that can be coerced into one), giving the feature types for the individual track items. When plotting the track to the device, if a display parameter with the same name as the value of
featureis set, this will be used as the track item's fill colour. Seegroupingfor details. Needs to be of equal length as the provided genomic coordinates, or of length 1.- group
Factor (or other vector that can be coerced into one), giving the group memberships for the individual track items. When plotting to the device, all items in the same group will be connected. See
groupingfor details. Needs to be of equal length as the provided genomic coordinates, or of length 1.- id
Character vector of track item identifiers. When plotting to the device, it's value will be used as the identifier tag if the display parameter
showFeatureId=TRUE. Needs to be of equal length as the provided genomic ranges, or of length 1.- strand
Character vector, the strand information for the individual track items. It may be provided in the form
+for the Watson strand,-for the Crick strand or*for either one of the two. Needs to be of equal length as the provided genomic coordinates, or of length 1. Please note that grouped items need to be on the same strand, and erroneous entries will result in casting of an error.- chromosome
The chromosome on which the track's genomic ranges are defined. A valid UCSC chromosome identifier if
options(ucscChromosomeNames=TRUE). Please note that in this case only syntactic checking takes place, i.e., the argument value needs to be an integer, numeric character or a character of the formchrx, wherexmay be any possible string. The user has to make sure that the respective chromosome is indeed defined for the the track's genome. If not provided here, the constructor will try to construct the chromosome information based on the available inputs, and as a last resort will fall back to the valuechrNA. Please note that by definition all objects in theGvizpackage can only have a single active chromosome at a time (although internally the information for more than one chromosome may be present), and the user has to call thechromosome<-replacement method in order to change to a different active chromosome.- genome
The genome on which the track's ranges are defined. Usually this is a valid UCSC genome identifier, however this is not being formally checked at this point. If not provided here the constructor will try to extract this information from the provided input, and eventually will fall back to the default value of
NA.- stacking
The stacking type for overlapping items of the track. One in
c(hide, dense, squish, pack,full). Currently, only squish (make best use of the available space), dense (no stacking, collapse overlapping ranges), and hide (do not show any track items at all) are implemented.- name
Character scalar of the track's name used in the title panel when plotting.
- fun
A function that is being called for each entry in the
AnnotationTrackobject. See section 'Details' and 'Examples' for further information. When called internally by the plotting machinery, a number of arguments are automatically passed on to this function, and the user needs to make sure that they can all be digested (i.e., either have all of them as formal named function arguments, or gobble up everything that is not needed in...). These arguments are:start: the genomic start coordinate of the range item.end: the genomic end coordinates of the range item.strand: the strand information for the range item.chromosome: the chromosome of the range item.identifier: the identifier of the range item, i.e., the result of callingidentifier(DetailsAnnotationTrack, lowest=TRUE). Typically those identifiers are passed on to the object constructor during instantiation as theidargument.index: a counter enumerating the ranges. TheAnnotationTrackobject is sorted internally for visibility, and theindexargument refers to the index of plotting.GdObject: a reference to the currently plottedDetailsAnnotationTrackobject.GdObject.original: a reference to theDetailsAnnotationTrackbefore any processing like item collapsing has taken place. Essentially, this is the track object as it exists in your working environment.
Additional arguments can be passed to the plotting function by means of the
detailsFunArgsargument (see below). Note that the plot must use grid graphics (e.g. function in the 'lattice' package or low-level grid functions). To access a data object such a matrix or data frame within the function you can either store it as a variable in the global environment or, to avoid name space conflicts, you can make it part of the function environment by means of a closure. Alternatively, you may want to explicitely stick it into an environment or pass it along in thedetailsFunArgslist. To figure out in your custom plotting function which annotation element is currently being plotted you can either use the identifier which has to be unique for each range element, or you may want to use the genomic position (start/end/strand/chromosome) e.g. if the data is stored in aGRangesobject.- selectFun
A function that is being called for each entry in the
AnnotationTrackobject with exactly the same arguments as infun. The purpose of this function is to decide for each track element whether details should be drawn, and consequently it has to return a single logical scalar. If the return value isTRUE, details will be drawn for the item, if it isFALSE, the details strip for the item is omitted.- importFunction
A user-defined function to be used to import the data from a file. This only applies when the
rangeargument is a character string with the path to the input data file. The function needs to accept an argumentxcontaining the file path and has to return a properGRangesobject with all the necessary metadata columns set. A set of default import functions is already implemented in the package for a number of different file types, and one of these defaults will be picked automatically based on the extension of the input file name. If the extension can not be mapped to any of the existing import function, an error is raised asking for a user-defined import function via this argument. Currently the following file types can be imported with the default functions:gff,gff1,gff2,gff3,bed,bam.
Value
The return value of the constructor function is a new object of class
AnnotationTrack or of class DetailsAnnotationTrack, depending
on the constructor arguments. Typically the user will not have to be
troubled with this distinction and can rely on the constructor to make the
right choice.
Functions
initialize(AnnotationTrack): Show method.ReferenceAnnotationTrack-class: The file-based version of theAnnotationTrack-class.initialize(ReferenceAnnotationTrack): Initialize.AnnotationTrack(): Constructor function forAnnotationTrack-classDetailsAnnotationTrack-class: directly extendsAnnotationTrack.DetailsAnnotationTrack(): Constructor function forDetailsAnnotationTrack-classThe
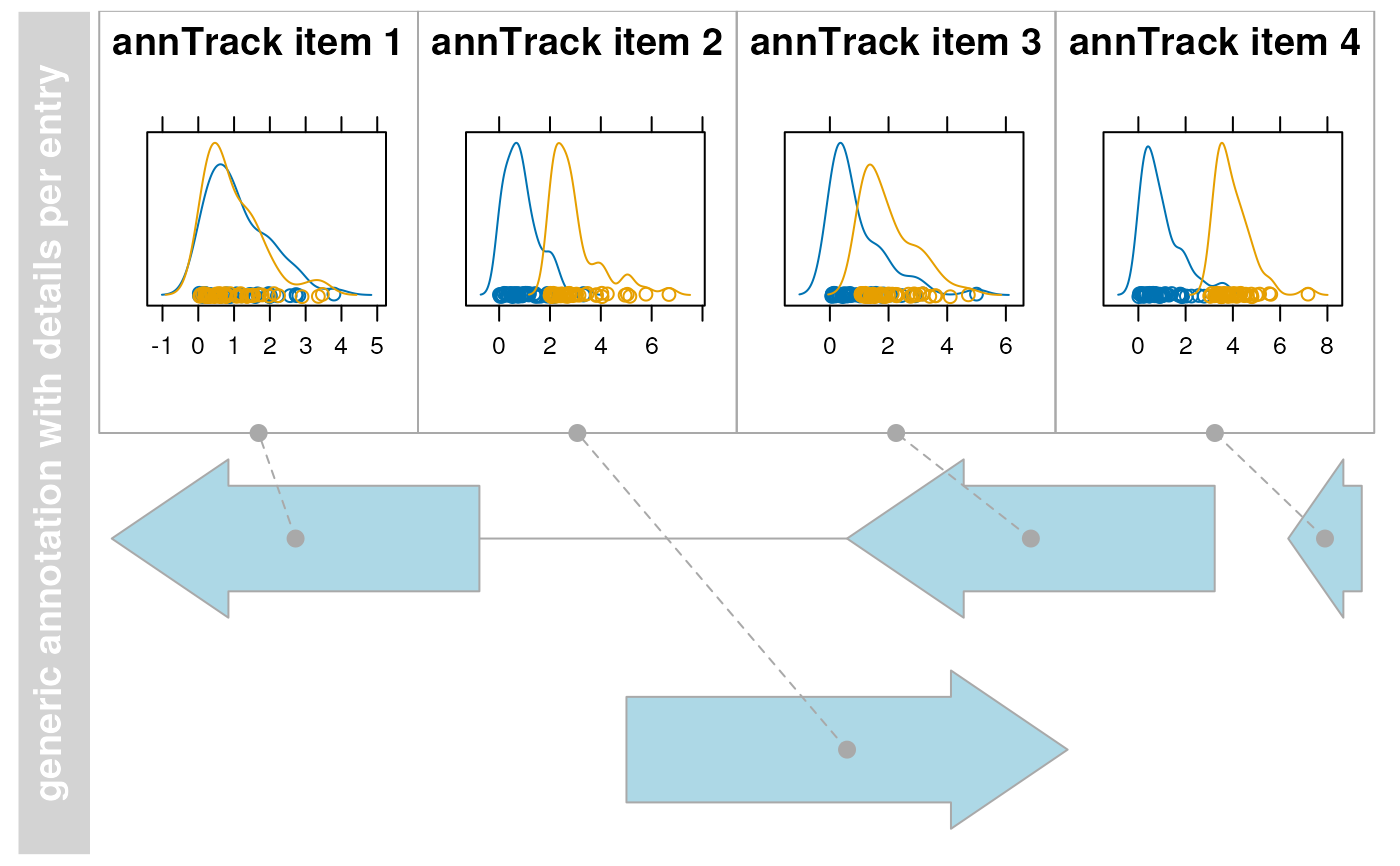
DetailsAnnotationTrackclass directly extendsAnnotationTrack.The purpose of this track type is to add an arbitrarily detailed plot section (typically consisting of additional quantitative data) for each range element of anAnnotationTrack.This allows a locus wide view of annotation elements together with any kind of details per feature or element that may for instance provide insight on how some complex quantitative measurements change according to their position in a locus. If the quantitative data is too complex for aDataTracke.g. because it requires extra space or a trellis-like representation, aDetailsAnnotationTrackcan be used instead. Example: AnAnnotationTrackshows the positions of a number of probes from a microarray, and you want a histogram of the signal intensity distribution derived from all samples at each of these probe location. Another example usage would be to show for each element of anAnnotationTrackan xy-plot of the signal against some clinical measurement such as blood pressure. The limitation for applications of this type of track is basically only the available space of the device you are plotting to.This flexibility is possible by utilizing a simple function model to perform all the detailed plotting. The functionality of this plotting function fun is totally up to the user, and the function environment is prepared in a way that all necessary information about the plotted annotation feature is available. To restrict the details section to only selected number of annotation features one can supply another function
selectFun, which decides for each feature separately whether details are available or not. Finally, an arbitrary number of additional arguments can be passed on to these two function by means of thedetailsFunArgsdisplay parameter. This is expected to be a named list, and all list elements are passed along to the plotting function fun and to the selector functionselectFunas additional named arguments. Please note that some argument names likestart,endoridentifierare reserved and can not be used in thedetailsFunArgslist. For examples of plotting functions, see the 'Examples' section.initialize(DetailsAnnotationTrack): Initialize.group(AnnotationTrack): extract the group membership for all track items.group(GdObject = AnnotationTrack) <- value: replace the grouping information for track items. The replacement value must be a factor of appropriate length or another vector that can be coerced into such.identifier(AnnotationTrack): return track item identifiers. Depending on the setting of the optional argument lowest, these are either the group identifiers or the individual item identifiers.identifier(GdObject = AnnotationTrack) <- value: Set the track item identifiers. The replacement value has to be a character vector of appropriate length. This always replaces the group-level identifiers, so essentially it is similar togroups<-.setStacks(AnnotationTrack): Recompute the stacks based on the available space and on the object's track items and stacking settings.consolidateTrack(AnnotationTrack): Consolidate. Determine whether there is group label annotation or not, and add this information as the internal display parameter.__hasAnno. Precompute the grouped ranges together with optional labels in order to determine the correct plotting range later.collapseTrack(AnnotationTrack): preprocess the track before plotting. This will collapse overlapping track items based on the available resolution and increase the width and height of all track objects to a minimum value to avoid rendering issues. See collapsing for details.subset(AnnotationTrack): subset aAnnotationTrackby coordinates and sort if necessary.subset(ReferenceAnnotationTrack): subset aReferenceAnnotationTrackby coordinates and sort if necessary.drawGD(AnnotationTrack): plot the object to a graphics device. The return value of this method is the input object, potentially updated during the plotting operation. Internally, there are two modes in which the method can be called. Either in 'prepare' mode, in which case no plotting is done but the object is preprocessed based on the available space, or in 'plotting' mode, in which case the actual graphical output is created. Since subsetting of the object can be potentially costly, this can be switched off in case subsetting has already been performed before or is not necessary.drawGD(DetailsAnnotationTrack): plot the object to a graphics device. The return value of this method is the input object, potentially updated during the plotting operation. Internally, there are two modes in which the method can be called. Either in 'prepare' mode, in which case no plotting is done but the object is preprocessed based on the available space, or in 'plotting' mode, in which case the actual graphical output is created. Since subsetting of the object can be potentially costly, this can be switched off in case subsetting has already been performed before or is not necessary.show(AnnotationTrack): Show method.show(ReferenceAnnotationTrack): Show method.
Slots
dpObject of
DisplayPars-class, the display settings controlling the look and feel of a track. See settings for details on setting graphical parameters for tracks.nameObject of class
character, a human-readable name for the track that will be used in the track's annotation panel if necessary.imageMapObject of
ImageMap-class, containing optional information for an HTML image map. This will be created by thedrawGDmethods when the track is plotted to a device and is usually not set by the user.rangeObject of class
GRanges, the genomic ranges of the track items as well as additional annotation information in itselementMetaDataslot. Please not that the slot is actually implemented as a class union betweenGRangesand IRanges to increase efficiency, for instance for DataTrack objects. This usually does not concern the user.chromosomeObject of class
character, the chromosome on which the track is defined. There can only be a single chromosome for one track. For certain subclasses, the space of allowed chromosome names is limited (e.g., only those chromosomes that exist for a particular genome). Throughout the package, chromosome name have to be entered either as a single integer scalar or as a character scalar of the form chrXYZ, where XYZ may be an arbitrary character string.genomeObject of class
character, the genome for which the track is defined. For most sub-classes this has to be valid UCSC genome identifier, however this may not always be formally checked upon object instantiation.stackingObject of class
character, the stacking type of overlapping items on the final plot. One inc(hide, dense, squish, pack,full). Currently, onlyhide(do not show the track items at all),squish(make best use of the available space) anddense(no stacking at all) are implemented.stacksObject of class
numeric, holding the stack indices for each track item. This slot is usually populated by calling thesetStacksmethod upon plotting, since the correct stacking is a function of the available plotting space.funA function that is being called for each AnnotationTrack element to plot details.
selectFunA function that is being called for each AnnotationTrack element to decide whether details need to be plotted.
Objects from the class
Objects can be created using the constructor function
AnnotationTrack.
See also
Examples
## An empty object
AnnotationTrack()
#> AnnotationTrack 'AnnotationTrack'
#> | genome: NA
#> | active chromosome: chrNA
#> | annotation features: 0
## Construct from individual arguments
st <- c(2000000, 2070000, 2100000, 2160000)
ed <- c(2050000, 2130000, 2150000, 2170000)
str <- c("-", "+", "-", "-")
gr <- c("Group1", "Group2", "Group1", "Group3")
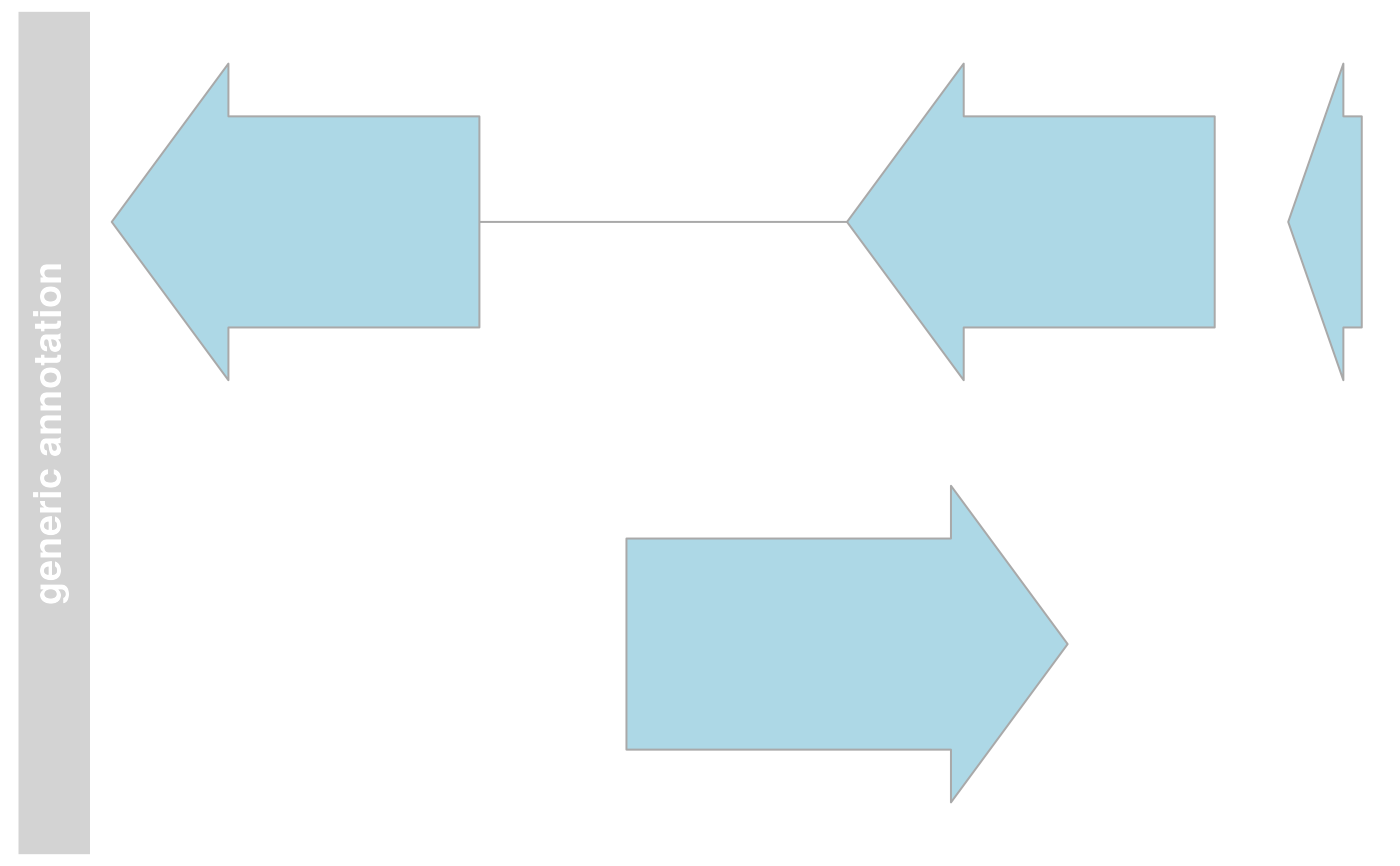
annTrack <- AnnotationTrack(
start = st, end = ed, strand = str, chromosome = 7,
genome = "hg19", feature = "test", group = gr,
id = paste("annTrack item", 1:4),
name = "generic annotation", stacking = "squish"
)
## Or from a data.frame
df <- data.frame(
start = st, end = ed, strand = str, id = paste("annTrack item", 1:4),
feature = "test", group = gr
)
annTrack <- AnnotationTrack(
range = df, genome = "hg19", chromosome = 7,
name = "generic annotation", stacking = "squish"
)
## Or from a GRanges object
gr <- GRanges(
seqnames = "chr7", range = IRanges(start = df$start, end = df$end),
strand = str
)
genome(gr) <- "hg19"
mcols(gr) <- df[, -(1:3)]
annTrack <- AnnotationTrack(
range = gr, name = "generic annotation",
stacking = "squish"
)
## Finally from a GRangesList
grl <- split(gr, values(gr)$group)
AnnotationTrack(grl)
#> AnnotationTrack 'AnnotationTrack'
#> | genome: hg19
#> | active chromosome: chr7
#> | annotation features: 4
## Plotting
plotTracks(annTrack)
 ## Track names
names(annTrack)
#> [1] "generic annotation"
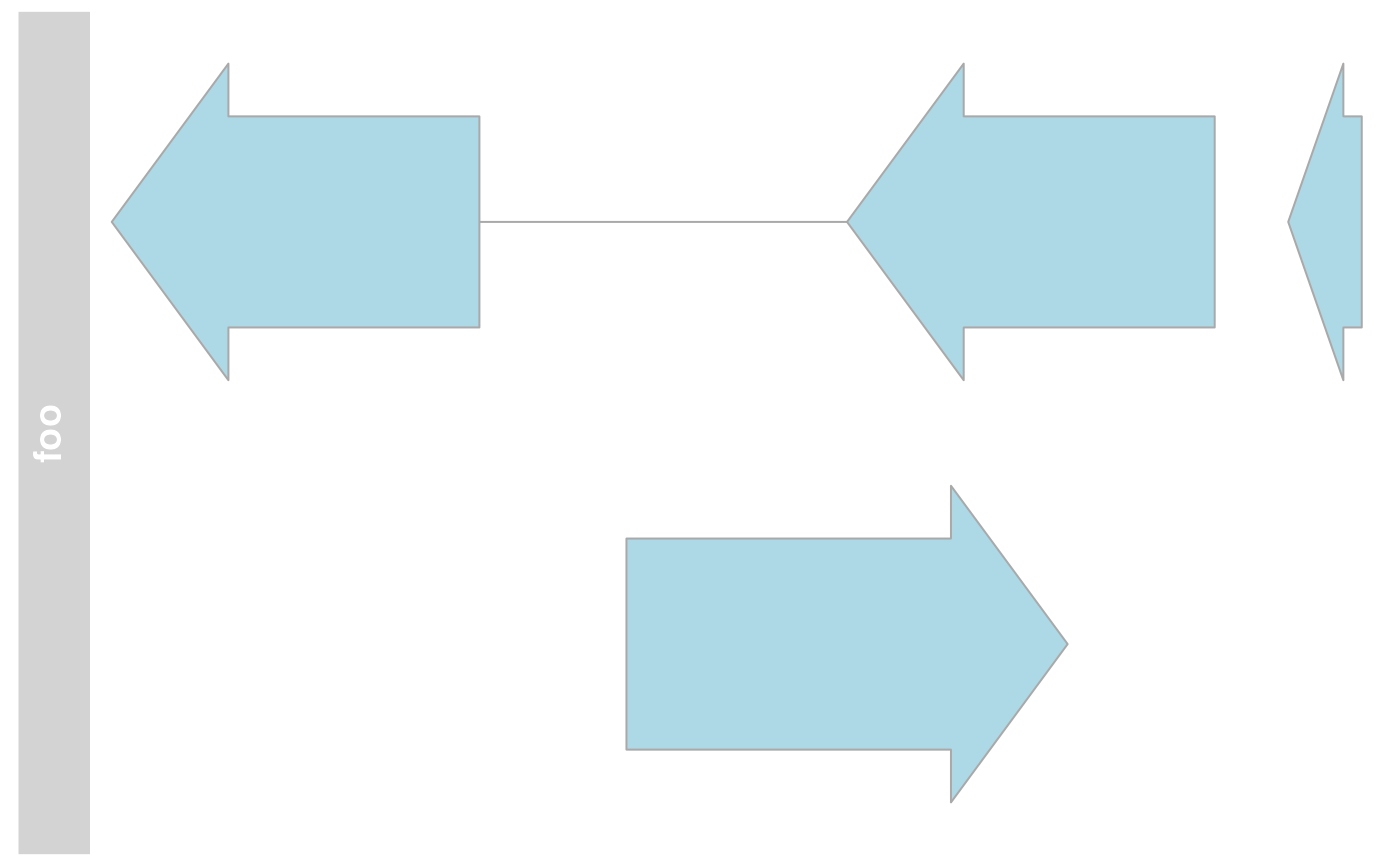
names(annTrack) <- "foo"
plotTracks(annTrack)
## Track names
names(annTrack)
#> [1] "generic annotation"
names(annTrack) <- "foo"
plotTracks(annTrack)
 ## Subsetting and splitting
subTrack <- subset(annTrack, to = 2155000)
length(subTrack)
#> [1] 3
subTrack[1:2]
#> AnnotationTrack 'foo'
#> | genome: hg19
#> | active chromosome: chr7
#> | annotation features: 2
split(annTrack, c(1, 2, 1, 2))
#> $`1`
#> AnnotationTrack 'foo'
#> | genome: hg19
#> | active chromosome: chr7
#> | annotation features: 2
#>
#> $`2`
#> AnnotationTrack 'foo'
#> | genome: hg19
#> | active chromosome: chr7
#> | annotation features: 2
#>
## Accessors
start(annTrack)
#> [1] 2000000 2070000 2100000 2160000
end(annTrack)
#> [1] 2050000 2130000 2150000 2170000
width(annTrack)
#> [1] 50001 60001 50001 10001
position(annTrack)
#> [1] 2025000 2100000 2125000 2165000
width(subTrack) <- width(subTrack) + 1000
strand(annTrack)
#> [1] "-" "+" "-" "-"
strand(subTrack) <- "-"
chromosome(annTrack)
#> [1] "chr7"
chromosome(subTrack) <- "chrX"
genome(annTrack)
#> chr7
#> "hg19"
genome(subTrack) <- "mm9"
range(annTrack)
#> IRanges object with 4 ranges and 0 metadata columns:
#> start end width
#> <integer> <integer> <integer>
#> [1] 2000000 2050000 50001
#> [2] 2070000 2130000 60001
#> [3] 2100000 2150000 50001
#> [4] 2160000 2170000 10001
ranges(annTrack)
#> GRanges object with 4 ranges and 4 metadata columns:
#> seqnames ranges strand | feature group id
#> <Rle> <IRanges> <Rle> | <character> <character> <character>
#> [1] chr7 2000000-2050000 - | test Group1 annTrack item 1
#> [2] chr7 2070000-2130000 + | test Group2 annTrack item 2
#> [3] chr7 2100000-2150000 - | test Group1 annTrack item 3
#> [4] chr7 2160000-2170000 - | test Group3 annTrack item 4
#> density
#> <numeric>
#> [1] 1
#> [2] 1
#> [3] 1
#> [4] 1
#> -------
#> seqinfo: 1 sequence from hg19 genome; no seqlengths
## Annotation
identifier(annTrack)
#> [1] "Group1" "Group2" "Group1" "Group3"
identifier(annTrack, "lowest")
#> [1] "annTrack item 1" "annTrack item 2" "annTrack item 3" "annTrack item 4"
identifier(subTrack) <- "bar"
feature(annTrack)
#> [1] "test" "test" "test" "test"
feature(subTrack) <- "foo"
values(annTrack)
#> feature group id density
#> 1 test Group1 annTrack item 1 1
#> 2 test Group2 annTrack item 2 1
#> 3 test Group1 annTrack item 3 1
#> 4 test Group3 annTrack item 4 1
## Grouping
group(annTrack)
#> [1] "Group1" "Group2" "Group1" "Group3"
group(subTrack) <- "Group 1"
chromosome(subTrack) <- "chr7"
plotTracks(subTrack)
## Subsetting and splitting
subTrack <- subset(annTrack, to = 2155000)
length(subTrack)
#> [1] 3
subTrack[1:2]
#> AnnotationTrack 'foo'
#> | genome: hg19
#> | active chromosome: chr7
#> | annotation features: 2
split(annTrack, c(1, 2, 1, 2))
#> $`1`
#> AnnotationTrack 'foo'
#> | genome: hg19
#> | active chromosome: chr7
#> | annotation features: 2
#>
#> $`2`
#> AnnotationTrack 'foo'
#> | genome: hg19
#> | active chromosome: chr7
#> | annotation features: 2
#>
## Accessors
start(annTrack)
#> [1] 2000000 2070000 2100000 2160000
end(annTrack)
#> [1] 2050000 2130000 2150000 2170000
width(annTrack)
#> [1] 50001 60001 50001 10001
position(annTrack)
#> [1] 2025000 2100000 2125000 2165000
width(subTrack) <- width(subTrack) + 1000
strand(annTrack)
#> [1] "-" "+" "-" "-"
strand(subTrack) <- "-"
chromosome(annTrack)
#> [1] "chr7"
chromosome(subTrack) <- "chrX"
genome(annTrack)
#> chr7
#> "hg19"
genome(subTrack) <- "mm9"
range(annTrack)
#> IRanges object with 4 ranges and 0 metadata columns:
#> start end width
#> <integer> <integer> <integer>
#> [1] 2000000 2050000 50001
#> [2] 2070000 2130000 60001
#> [3] 2100000 2150000 50001
#> [4] 2160000 2170000 10001
ranges(annTrack)
#> GRanges object with 4 ranges and 4 metadata columns:
#> seqnames ranges strand | feature group id
#> <Rle> <IRanges> <Rle> | <character> <character> <character>
#> [1] chr7 2000000-2050000 - | test Group1 annTrack item 1
#> [2] chr7 2070000-2130000 + | test Group2 annTrack item 2
#> [3] chr7 2100000-2150000 - | test Group1 annTrack item 3
#> [4] chr7 2160000-2170000 - | test Group3 annTrack item 4
#> density
#> <numeric>
#> [1] 1
#> [2] 1
#> [3] 1
#> [4] 1
#> -------
#> seqinfo: 1 sequence from hg19 genome; no seqlengths
## Annotation
identifier(annTrack)
#> [1] "Group1" "Group2" "Group1" "Group3"
identifier(annTrack, "lowest")
#> [1] "annTrack item 1" "annTrack item 2" "annTrack item 3" "annTrack item 4"
identifier(subTrack) <- "bar"
feature(annTrack)
#> [1] "test" "test" "test" "test"
feature(subTrack) <- "foo"
values(annTrack)
#> feature group id density
#> 1 test Group1 annTrack item 1 1
#> 2 test Group2 annTrack item 2 1
#> 3 test Group1 annTrack item 3 1
#> 4 test Group3 annTrack item 4 1
## Grouping
group(annTrack)
#> [1] "Group1" "Group2" "Group1" "Group3"
group(subTrack) <- "Group 1"
chromosome(subTrack) <- "chr7"
plotTracks(subTrack)
 ## Stacking
stacking(annTrack)
#> [1] "squish"
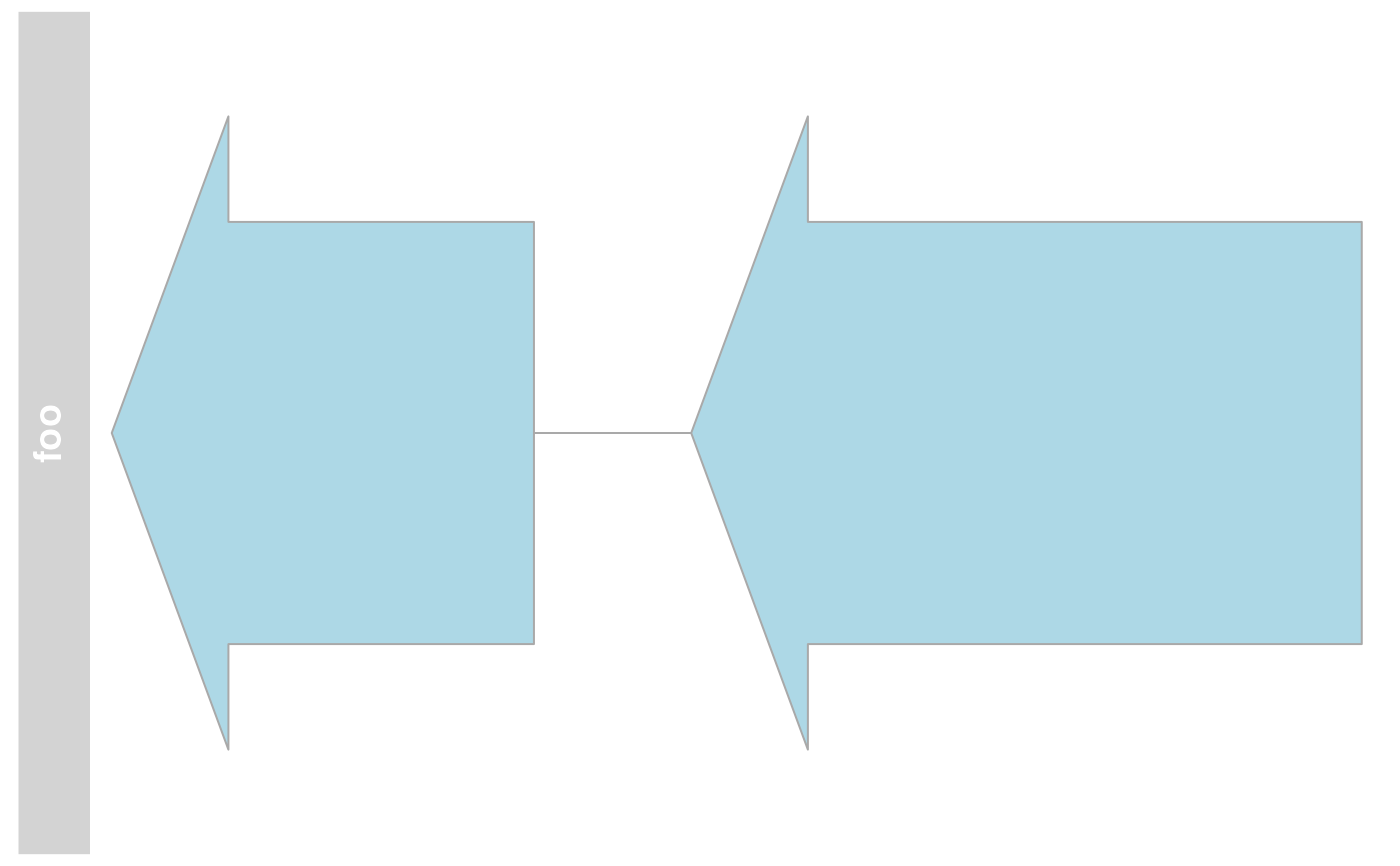
stacking(annTrack) <- "dense"
plotTracks(annTrack)
## Stacking
stacking(annTrack)
#> [1] "squish"
stacking(annTrack) <- "dense"
plotTracks(annTrack)
 ## coercion
as(annTrack, "data.frame")
#> X.seqnames X.start X.end X.width X.strand X.feature X.group X.id
#> 1 chr7 2000000 2050000 50001 - test Group1 annTrack item 1
#> 2 chr7 2070000 2130000 60001 + test Group2 annTrack item 2
#> 3 chr7 2100000 2150000 50001 - test Group1 annTrack item 3
#> 4 chr7 2160000 2170000 10001 - test Group3 annTrack item 4
#> X.density feature group id density
#> 1 1 test Group1 annTrack item 1 1
#> 2 1 test Group2 annTrack item 2 1
#> 3 1 test Group1 annTrack item 3 1
#> 4 1 test Group3 annTrack item 4 1
as(annTrack, "UCSCData")
#> UCSC track 'foo'
#> UCSCData object with 4 ranges and 3 metadata columns:
#> seqnames ranges strand | id name
#> <Rle> <IRanges> <Rle> | <character> <character>
#> [1] chr7 2000000-2050000 - | annTrack_item_1 annTrack_item_1
#> [2] chr7 2070000-2130000 + | annTrack_item_2 annTrack_item_2
#> [3] chr7 2100000-2150000 - | annTrack_item_3 annTrack_item_3
#> [4] chr7 2160000-2170000 - | annTrack_item_4 annTrack_item_4
#> itemRgb
#> <character>
#> [1] lightblue
#> [2] lightblue
#> [3] lightblue
#> [4] lightblue
#> -------
#> seqinfo: 1 sequence from an unspecified genome; no seqlengths
## HTML image map
coords(annTrack)
#> NULL
tags(annTrack)
#> NULL
annTrack <- plotTracks(annTrack)$foo
## coercion
as(annTrack, "data.frame")
#> X.seqnames X.start X.end X.width X.strand X.feature X.group X.id
#> 1 chr7 2000000 2050000 50001 - test Group1 annTrack item 1
#> 2 chr7 2070000 2130000 60001 + test Group2 annTrack item 2
#> 3 chr7 2100000 2150000 50001 - test Group1 annTrack item 3
#> 4 chr7 2160000 2170000 10001 - test Group3 annTrack item 4
#> X.density feature group id density
#> 1 1 test Group1 annTrack item 1 1
#> 2 1 test Group2 annTrack item 2 1
#> 3 1 test Group1 annTrack item 3 1
#> 4 1 test Group3 annTrack item 4 1
as(annTrack, "UCSCData")
#> UCSC track 'foo'
#> UCSCData object with 4 ranges and 3 metadata columns:
#> seqnames ranges strand | id name
#> <Rle> <IRanges> <Rle> | <character> <character>
#> [1] chr7 2000000-2050000 - | annTrack_item_1 annTrack_item_1
#> [2] chr7 2070000-2130000 + | annTrack_item_2 annTrack_item_2
#> [3] chr7 2100000-2150000 - | annTrack_item_3 annTrack_item_3
#> [4] chr7 2160000-2170000 - | annTrack_item_4 annTrack_item_4
#> itemRgb
#> <character>
#> [1] lightblue
#> [2] lightblue
#> [3] lightblue
#> [4] lightblue
#> -------
#> seqinfo: 1 sequence from an unspecified genome; no seqlengths
## HTML image map
coords(annTrack)
#> NULL
tags(annTrack)
#> NULL
annTrack <- plotTracks(annTrack)$foo
 coords(annTrack)
#> x1 y1 x2 y2
#> annTrack item 1 38.10304 67.5 171.2010 436.5
#> annTrack item 3 304.29899 67.5 437.3970 436.5
#> annTrack item 2 224.44021 67.5 384.1578 436.5
#> annTrack item 4 464.01657 67.5 490.6362 436.5
tags(annTrack)
#> $fill
#> annTrack item 1 annTrack item 3 annTrack item 2 annTrack item 4
#> "lightblue" "lightblue" "lightblue" "lightblue"
#>
#> $strand
#> annTrack item 1 annTrack item 3 annTrack item 2 annTrack item 4
#> "-" "-" "+" "-"
#>
#> $text
#> annTrack item 1 annTrack item 3 annTrack item 2 annTrack item 4
#> "annTrack item 1" "annTrack item 3" "annTrack item 2" "annTrack item 4"
#>
#> $start
#> annTrack item 1 annTrack item 3 annTrack item 2 annTrack item 4
#> "2000000" "2100000" "2070000" "2160000"
#>
#> $end
#> annTrack item 1 annTrack item 3 annTrack item 2 annTrack item 4
#> "2050000" "2150000" "2130000" "2170000"
#>
#> $feature
#> annTrack item 1 annTrack item 3 annTrack item 2 annTrack item 4
#> "test" "test" "test" "test"
#>
#> $group
#> annTrack item 1 annTrack item 3 annTrack item 2 annTrack item 4
#> "Group1" "Group1" "Group2" "Group3"
#>
#> $id
#> annTrack item 1 annTrack item 3 annTrack item 2 annTrack item 4
#> "annTrack item 1" "annTrack item 3" "annTrack item 2" "annTrack item 4"
#>
#> $density
#> annTrack item 1 annTrack item 3 annTrack item 2 annTrack item 4
#> "1" "1" "1" "1"
#>
#> $exonId
#> annTrack item 1 annTrack item 3 annTrack item 2 annTrack item 4
#> "annTrack item 1" "annTrack item 3" "annTrack item 2" "annTrack item 4"
#>
#> $origExonId
#> annTrack item 1 annTrack item 3 annTrack item 2 annTrack item 4
#> "annTrack item 1" "annTrack item 3" "annTrack item 2" "annTrack item 4"
#>
#> $col
#> annTrack item 1 annTrack item 3 annTrack item 2 annTrack item 4
#> "darkgray" "darkgray" "darkgray" "darkgray"
#>
#> $title
#> [1] "Group1" "Group1" "Group2" "Group3"
#>
## DetailsAnnotationTrack
library(lattice) # need to use grid grapics
## generate two random distributions per row (probe/feature)
## the difference between the distributions increases from probe 1 to 4
m <- matrix(c(rgamma(400, 1)), ncol = 100)
m[, 51:100] <- m[, 51:100] + 0:3
## rownames must be accessible by AnnotationTrack element identifier
rownames(m) <- identifier(annTrack, "lowest")
## create a lattice density plot for the values (signals) of the two groups
## as the chart must be placed into a pre-set grid view port we have to use
## print without calling plot.new! Note, use a common prefix for all lattice.
## Avoid wasting space by removing y-axis decorations.
## Note, in this example 'm' will be found in the environment the 'details'
## function is defined in. To avoid overwriting 'm' you should use a closure
## or environment to access 'm'.
details <- function(identifier, ...) {
d <- data.frame(signal = m[identifier, ], group = rep(c("grp1", "grp2"), each = 50))
print(densityplot(~signal,
group = group, data = d, main = identifier,
scales = list(draw = FALSE, x = list(draw = TRUE)), ylab = "", xlab = "",
), newpage = FALSE, prefix = "plot")
}
deTrack <- AnnotationTrack(
range = gr, genome = "hg19", chromosome = 7,
name = "generic annotation with details per entry", stacking = "squish",
fun = details, details.ratio = 1
)
plotTracks(deTrack)
coords(annTrack)
#> x1 y1 x2 y2
#> annTrack item 1 38.10304 67.5 171.2010 436.5
#> annTrack item 3 304.29899 67.5 437.3970 436.5
#> annTrack item 2 224.44021 67.5 384.1578 436.5
#> annTrack item 4 464.01657 67.5 490.6362 436.5
tags(annTrack)
#> $fill
#> annTrack item 1 annTrack item 3 annTrack item 2 annTrack item 4
#> "lightblue" "lightblue" "lightblue" "lightblue"
#>
#> $strand
#> annTrack item 1 annTrack item 3 annTrack item 2 annTrack item 4
#> "-" "-" "+" "-"
#>
#> $text
#> annTrack item 1 annTrack item 3 annTrack item 2 annTrack item 4
#> "annTrack item 1" "annTrack item 3" "annTrack item 2" "annTrack item 4"
#>
#> $start
#> annTrack item 1 annTrack item 3 annTrack item 2 annTrack item 4
#> "2000000" "2100000" "2070000" "2160000"
#>
#> $end
#> annTrack item 1 annTrack item 3 annTrack item 2 annTrack item 4
#> "2050000" "2150000" "2130000" "2170000"
#>
#> $feature
#> annTrack item 1 annTrack item 3 annTrack item 2 annTrack item 4
#> "test" "test" "test" "test"
#>
#> $group
#> annTrack item 1 annTrack item 3 annTrack item 2 annTrack item 4
#> "Group1" "Group1" "Group2" "Group3"
#>
#> $id
#> annTrack item 1 annTrack item 3 annTrack item 2 annTrack item 4
#> "annTrack item 1" "annTrack item 3" "annTrack item 2" "annTrack item 4"
#>
#> $density
#> annTrack item 1 annTrack item 3 annTrack item 2 annTrack item 4
#> "1" "1" "1" "1"
#>
#> $exonId
#> annTrack item 1 annTrack item 3 annTrack item 2 annTrack item 4
#> "annTrack item 1" "annTrack item 3" "annTrack item 2" "annTrack item 4"
#>
#> $origExonId
#> annTrack item 1 annTrack item 3 annTrack item 2 annTrack item 4
#> "annTrack item 1" "annTrack item 3" "annTrack item 2" "annTrack item 4"
#>
#> $col
#> annTrack item 1 annTrack item 3 annTrack item 2 annTrack item 4
#> "darkgray" "darkgray" "darkgray" "darkgray"
#>
#> $title
#> [1] "Group1" "Group1" "Group2" "Group3"
#>
## DetailsAnnotationTrack
library(lattice) # need to use grid grapics
## generate two random distributions per row (probe/feature)
## the difference between the distributions increases from probe 1 to 4
m <- matrix(c(rgamma(400, 1)), ncol = 100)
m[, 51:100] <- m[, 51:100] + 0:3
## rownames must be accessible by AnnotationTrack element identifier
rownames(m) <- identifier(annTrack, "lowest")
## create a lattice density plot for the values (signals) of the two groups
## as the chart must be placed into a pre-set grid view port we have to use
## print without calling plot.new! Note, use a common prefix for all lattice.
## Avoid wasting space by removing y-axis decorations.
## Note, in this example 'm' will be found in the environment the 'details'
## function is defined in. To avoid overwriting 'm' you should use a closure
## or environment to access 'm'.
details <- function(identifier, ...) {
d <- data.frame(signal = m[identifier, ], group = rep(c("grp1", "grp2"), each = 50))
print(densityplot(~signal,
group = group, data = d, main = identifier,
scales = list(draw = FALSE, x = list(draw = TRUE)), ylab = "", xlab = "",
), newpage = FALSE, prefix = "plot")
}
deTrack <- AnnotationTrack(
range = gr, genome = "hg19", chromosome = 7,
name = "generic annotation with details per entry", stacking = "squish",
fun = details, details.ratio = 1
)
plotTracks(deTrack)
 set.seed(1234)
deTrack <- AnnotationTrack(
range = gr, genome = "hg19", chromosome = 7,
name = "generic annotation with details per entry",
stacking = "squish", fun = details,
details.ratio = 1, selectFun = function(...) {
sample(c(FALSE, TRUE), 1)
}
)
plotTracks(deTrack)
set.seed(1234)
deTrack <- AnnotationTrack(
range = gr, genome = "hg19", chromosome = 7,
name = "generic annotation with details per entry",
stacking = "squish", fun = details,
details.ratio = 1, selectFun = function(...) {
sample(c(FALSE, TRUE), 1)
}
)
plotTracks(deTrack)