Setting display parameters to control the look and feel of the plots
Source:R/settings.R
settings.RdThe genome track plots in this package are all highly customizable by means of so called 'display parameters'. This page highlights the use of these parameters and list all available settings for the different track classes.
Arguments
Value
The getScheme function returns current scheme as a list structure.
Details
All of the package's track objects inherit the dp slot from the
GdObject parent class, which is the main container to
store an object's display parameters. Internally, the content of this slot
has to be an object of class DisplayPars, but the user
is usually not exposed to this low level implementation. Instead, there are
two main interaction points, namely the individual object constructor
functions and the final plotTracks function. In both cases,
all additional arguments that are not caught by any of the formally defined
function parameters are being interpreted as additional display parameters
and are automatically added to the aforementioned slot. The main difference
here is that display parameters that are passed on to the constructor
function are specific for an individual track object, whereas those supplied
to the plotTracks function will be applied to all the objects in the
plotting list. Not all display parameters have an effect on the plotting of
all track classes, and those will be silently ignored.
One can query the available display parameters for a given class as well as
their default values by calling the availableDisplayPars
function, or by inspecting the man pages of the individual track classes.
The structure of the classes defined in this package is hierarchical, and so
are the available display parameters, i.e., all objects inherit the
parameters defined in the commom GdObject parent class, and so on.
Once a track object has been created, the display parameters are still open
for modification. To this end, the DisplayPars replacement
method is available for all objects inheriting from class GdObject.
The method takes a named list of parameters as input, e.g.:
displayPars(foo) <- list(col="red", lwd=2)
In the same spirit, the currently set display parameters for the object
foo can be inferred using the displayPars method directly,
e.g.:
displayPars(foo)
For track objects inheriting from class
AnnotationTrack, display parameters that are not
formally defined in the class definition or in any of the parent classes are
considered to be valid R color identifiers that are used to distinguish
between different types of annotation features. For instance, the parameter
'miRNA' will be used to color all annotation features of class miRNA. The
annotation types can be set in the constructor function of the track object
via the feature argument. For most of the tracks that have been
inferred from one of the online repositories, this classification will
usually be downloaded along with the actual annotation data.
Users might find themselves changing the same parameters over and over
again, and it would make sense to register these modifications in a central
location once and for all. To this end the Gviz package supports display
parameter schemes. A scheme is essentially just a bunch of nested named
lists, where the names on the first level of nesting should correspond to
track class names, and the names on the second level to the display
parameters to set. The currently active schmeme can be changed by setting
the global option Gviz.scheme, and a new scheme can be registered by
using the addScheme function, providing both the list and the name
for the new scheme. The getScheme function is useful to get the
current scheme as a list structure, for instance to use as a skeleton for
your own custom scheme.
In order to make these settings persitant across R sessions one can create
one or several schemes in the global environment in the special object
.GvizSchemes, for instance by putting the necessary code in the
.Rprofile file. This object needs to be a named list of schemes, and
it will be collected when the Givz package loads. Its content is then
automatically added to the collection of available schemes.
Please note that because display parameters are stored with the track objects, a scheme change only has an effect on those objects that are created after the change has taken place.
Display Parameters
- GenomeAxisTrack:
-
add35=FALSE:Logical scalar. Add 3' to 5' direction indicators.
add53=FALSE:Logical scalar. Add 5' to 3' direction indicators.
background.title="transparent":Character scalar. The background color for the title panel. Defaults to omit the background.
cex.id=0.7:Numeric scalar. The text size for the optional range annotation.
cex=0.8:Numeric scalar. The overall font expansion factor for the axis annotation text.
col.border.title="transparent":Integer or character scalar. The border color for the title panels.
lwd.border.title=1:Integer scalar. The border width for the title panels.
col.id="white":Character scalar. The text color for the optional range annotation.
col.range="cornsilk4":Character scalar. The border color for highlighted regions on the axis.
distFromAxis=1:Numeric scalar. Control the distance of the axis annotation from the tick marks.
exponent=NULL:Numeric scalar. The exponent for the axis coordinates, e.g., 3 means mb, 6 means gb, etc. The default is to automatically determine the optimal exponent.
fill.range="cornsilk3":Character scalar. The fill color for highlighted regions on the axis.
fontcolor="#808080":Character scalar. The font color for the axis annotation text.
fontsize=10:Numeric scalar. Font size for the axis annotation text in points.
labelPos="alternating":Character vector, one in "alternating", "revAlternating", "above" or "below". The vertical positioning of the axis labels. If
scaleis notNULL, the possible values are "above", "below" and "beside".littleTicks=FALSE:Logical scalar. Add more fine-grained tick marks.
lwd=2:Numeric scalar. The line width for the axis elementes.
scale=NULL:Numeric scalar. If not
NULLa small scale is drawn instead of the full axis, if the value is between 0 and 1 it is interpreted as a fraction of the current plotting region, otherwise as an absolute length value in genomic coordinates.showId=FALSE:Logical scalar. Show the optional range highlighting annotation.
showTitle=FALSE:Logical scalar. Plot a title panel. Defaults to omit the title panel.
ticksAt=NULL:Numeric scalar. The exact x-position for tickmarks (in base-pairs).
size=NULL:Numeric scalar. The relative size of the track. Can be overridden in the
plotTracksfunction. Defaults to the ideal size based on the other track settings.col="darkgray":Character scalar. The color for the axis lines and tickmarks.
Inherited from class GdObject:
alpha=1:Numeric scalar. The transparency for all track items.
alpha.title=NULL:Numeric scalar. The transparency for the title panel.
background.panel="transparent":Integer or character scalar. The background color of the content panel.
background.legend="transparent":Integer or character scalar. The background color for the legend.
cex.axis=NULL:Numeric scalar. The expansion factor for the axis annotation. Defaults to
NULL, in which case it is automatically determined based on the available space.cex.title=NULL:Numeric scalar. The expansion factor for the title panel. This effects the fontsize of both the title and the axis, if any. Defaults to
NULL, which means that the text size is automatically adjusted to the available space.col.axis="white":Integer or character scalar. The font and line color for the y axis, if any.
col.frame="lightgray":Integer or character scalar. The line color used for the panel frame, if
frame==TRUEcol.grid="#808080":Integer or character scalar. Default line color for grid lines, both when
type=="g"inDataTracks and when display parametergrid==TRUE.col.line=NULL:Integer or character scalar. Default colors for plot lines. Usually the same as the global
colparameter.col.symbol=NULL:Integer or character scalar. Default colors for plot symbols. Usually the same as the global
colparameter.col.title="white":Integer or character scalar. The border color for the title panels
collapse=TRUE:Boolean controlling whether to collapse the content of the track to accomodate the minimum current device resolution. See
collapsingfor details.fill="lightgray":Integer or character scalar. Default fill color setting for all plotting elements, unless there is a more specific control defined elsewhere.
fontface.title=2:Integer or character scalar. The font face for the title panels.
fontface=1:Integer or character scalar. The font face for all text, unless a more specific definition exists.
fontfamily.title="sans":Integer or character scalar. The font family for the title panels.
fontfamily="sans":Integer or character scalar. The font family for all text, unless a more specific definition exists.
frame=FALSE:Boolean. Draw a frame around the track when plotting.
grid=FALSE:Boolean, switching on/off the plotting of a grid.
h=-1:Integer scalar. Parameter controlling the number of horizontal grid lines, see
panel.gridfor details.lineheight=1:Numeric scalar. The font line height for all text, unless a more specific definition exists.
lty.grid="solid":Integer or character scalar. Default line type for grid lines, both when
type=="g"inDataTracks and when display parametergrid==TRUE.lty="solid":Numeric scalar. Default line type setting for all plotting elements, unless there is a more specific control defined elsewhere.
lwd.title=1:Integer scalar. The border width for the title panels
lwd.grid=1:Numeric scalar. Default line width for grid lines, both when
type=="g"inDataTracks and when display parametergrid==TRUE.min.distance=1:Numeric scalar. The minimum pixel distance before collapsing range items, only if
collapse==TRUE. Seecollapsingfor details.min.height=3:Numeric scalar. The minimum range height in pixels to display. All ranges are expanded to this size in order to avoid rendering issues. See
collapsingfor details.min.width=1:Numeric scalar. The minimum range width in pixels to display. All ranges are expanded to this size in order to avoid rendering issues. See
collapsingfor details.reverseStrand=FALSE:Logical scalar. Set up the plotting coordinates in 3' -> 5' direction if
TRUE. This will effectively mirror the plot on the vertical axis.rotation.title=90:The rotation angle for the text in the title panel. Even though this can be adjusted, the automatic resizing of the title panel will currently not work, so use at own risk.
rotation=0:The rotation angle for all text unless a more specific definiton exists.
showAxis=TRUE:Boolean controlling whether to plot a y axis (only applies to track types where axes are implemented).
v=-1:Integer scalar. Parameter controlling the number of vertical grid lines, see
panel.gridfor details.
- DataTrack:
-
aggregateGroups=FALSE:Logical scalar. Aggregate the values within a sample group using the aggregation funnction specified in the
aggregationparameter.aggregation="mean":Function or character scalar. Used to aggregate values in windows or for collapsing overlapping items. The function has to accept a numeric vector as a single input parameter and has to return a numeric scalar with the aggregated value. Alternatively, one of the predefined options
mean,mediansum,min,maxorextremecan be supplied as a character scalar. Defaults tomean.missingAsZero=TRUE:Logical scalar. Defines how the missing values are treated in the aggregation procedure with running window. Setting it to
TRUEfills empty positions with zeros, which is default.FALSEfills empty positions withNA.alpha.confint=0.3:Numeric scalar. The transparency for the confidence intervalls in confint-type plots.
amount=NULL:Numeric scalar. Amount of jittering in xy-type plots. See
panel.xyplotfor details.baseline=NULL:Numeric scalar. Y-axis position of an optional baseline. This parameter has a special meaning for mountain-type and polygon-type plots, see the 'Details' section in
DataTrackfor more information.box.legend=FALSE:Logical scalar. Draw a box around a legend.
box.ratio=1:Numeric scalar. Parameter controlling the boxplot appearance. See
panel.bwplotfor details.box.width=NULL:Numeric scalar. Parameter controlling the boxplot appearance. See
panel.bwplotfor details.grid=FALSE:Logical vector. Draw a line grid under the track content.
cex.legend=0.8:Numeric scalar. The size factor for the legend text.
cex.sampleNames=NULL:Numeric scalar. The size factor for the sample names text in heatmap or horizon plots. Defaults to an automatic setting.
cex=0.7:Numeric scalar. The default pixel size for plotting symbols.
coef=1.5:Numeric scalar. Parameter controlling the boxplot appearance. See
panel.bwplotfor details.col.baseline=NULL:Character scalar. Color for the optional baseline, defaults to the setting of
col.col.confint=NA:Character vector. Border colors for the confidence intervals for confint-type plots.
col.boxplotFrame="#808080":Character scalar. Line color of the frame around grouped boxplots.
col.histogram="#808080":Character scalar. Line color in histogram-type plots.
col.horizon=NA:The line color for the segments in the
horizon-type plot. Seehorizonplotfor details.col.mountain=NULL:Character scalar. Line color in mountain-type and polygon-type plots, defaults to the setting of
col.col.sampleNames="white":Character or integer scalar. The color used for the sample names in heatmap plots.
col=c("#0080ff", "#ff00ff", "darkgreen", "#ff0000", "orange", "#00ff00", "brown"):Character or integer vector. The color used for all line and symbol elements, unless there is a more specific control defined elsewhere. Unless
groupsare specified, only the first color in the vector is usually regarded.collapse=FALSE:Logical scalar. Collapse overlapping ranges and aggregate the underlying data.
degree=1:Numeric scalar. Parameter controlling the loess calculation for smooth and mountain-type plots. See
panel.loessfor details.do.out=TRUE:Logical scalar. Parameter controlling the boxplot appearance. See
panel.bwplotfor details.evaluation=50:Numeric scalar. Parameter controlling the loess calculation for smooth and mountain-type plots. See
panel.loessfor details.factor=0.5:Numeric scalar. Factor to control amount of jittering in xy-type plots. See
panel.xyplotfor details.family="symmetric":Character scalar. Parameter controlling the loess calculation for smooth and mountain-type plots. See
panel.loessfor details.fill.confint=NULL:Character vector. Fill colors for the confidence intervals for confint-type plots.
fill.histogram=NULL:Character scalar. Fill color in histogram-type plots, defaults to the setting of
fill.fill.horizon=c("#B41414", "#E03231", "#F7A99C", "#9FC8DC", "#468CC8", "#0165B3"):The fill colors for the segments in the
horizon-type plot. This should be a vector of length six, where the first three entries are the colors for positive changes, and the latter three entries are the colors for negative changes. Defaults to a red-blue color scheme. Seehorizonplotfor details.fill.mountain=c("#CCFFFF", "#FFCCFF"):Character vector of length 2. Fill color in mountain-type and polygon-type plots.
fontface.legend=NULL:Integer or character scalar. The font face for the legend text.
fontfamily.legend=NULL:Integer or character scalar. The font family for the legend text.
fontsize.legend=NULL:Numeric scalar. The pixel size for the legend text.
fontcolor.legend="#808080":Integer or character scalar. The font color for the legend text.
gradient=c("#F7FBFF", "#DEEBF7", "#C6DBEF", "#9ECAE1", "#6BAED6", "#4292C6", "#2171B5", "#08519C", "#08306B"):Character vector. The base colors for the
gradientplotting type or theheatmaptype with a single group. When plotting heatmaps with more than one group, thecolparameter can be used to control the group color scheme, however the gradient will always be from white to 'col' and thus does not offer as much flexibility as thisgradientparameter.groups=NULL:Vector coercable to a factor. Optional sample grouping. See 'Details' section in
DataTrackfor further information.horizon.origin=0:The baseline relative to which changes are indicated on the
horizon-type plot. Seehorizonplotfor details.horizon.scale=NULL:The scale for each of the segments in the
horizon-type plot. Defaults to 1/3 of the absolute data range. Seehorizonplotfor details.jitter.x=FALSE:Logical scalar. Toggle on jittering on the x axis in xy-type plots. See
panel.xyplotfor details.jitter.y=FALSE:Logical scalar. Toggle off jittering on the y axis in xy-type plots. See
panel.xyplotfor details.levels.fos=NULL:Numeric scalar. Parameter controlling the boxplot appearance. See
panel.bwplotfor details.legend=TRUE:Boolean triggering the addition of a legend to the track to indicate groups. This only has an effect if at least two groups are present.
lineheight.legend=NULL:Numeric scalar. The line height for the legend text.
lty.baseline=NULL:Character or numeric scalar. Line type of the optional baseline, defaults to the setting of
lty.lty.mountain=NULL:Character or numeric scalar. Line type in mountain-type and polygon-type plots, defaults to the setting of
lty.lwd.baseline=NULL:Numeric scalar. Line width of the optional baseline, defaults to the setting of
lwd.lwd.mountain=NULL:Numeric scalar. Line width in mountain-type and polygon-type plots, defaults to the setting of
lwd.min.distance=0:Numeric scalar. The mimimum distance in pixel below which to collapse ranges.
na.rm=FALSE:Boolean controlling whether to discard all NA values when plotting or to keep empty spaces for NAs
ncolor=100:Integer scalar. The number of colors for the 'gradient' plotting type
notch.frac=0.5:Numeric scalar. Parameter controlling the boxplot appearance. See
panel.bwplotfor details.notch=FALSE:Logical scalar. Parameter controlling the boxplot appearance. See
panel.bwplotfor details.pch=20:Integer scalar. The type of glyph used for plotting symbols.
separator=0:Numeric scalar. Number of pixels used to separate individual samples in heatmap- and horizon-type plots.
showColorBar=TRUE:Boolean. Indicate the data range color mapping in the axis for 'heatmap' or 'gradient' types.
showSampleNames=FALSE:Boolean. Display the names of the individual samples in a heatmap or a horizon plot.
size=NULL:Numeric scalar. The relative size of the track. Can be overridden in the
plotTracksfunction. By default the size will be set automatically based on the selected plotting type.span=0.2:Numeric scalar. Parameter controlling the loess calculation for smooth and mountain-type plots. See
panel.loessfor details.stackedBars=TRUE:Logical scalar. When there are several data groups, draw the histogram-type plots as stacked barplots or grouped side by side.
stats=X[[i]]:Function. Parameter controlling the boxplot appearance. See
panel.bwplotfor details.transformation=NULL:Function. Applied to the data matrix prior to plotting or when calling the
scoremethod. The function should accept exactly one input argument and its return value needs to be a numeric vector which can be coerced back into a data matrix of identical dimensionality as the input data.type="p":Character vector. The plot type, one or several in
p,l,b,a,a_confint,s,g,r,S,confint,smooth,histogram,mountain,polygon,h,boxplot,gradient,heatmap,horizon. See 'Details' section inDataTrackfor more information on the individual plotting types.varwidth=FALSE:Logical scalar. Parameter controlling the boxplot appearance. See
panel.bwplotfor details.window=NULL:Numeric or character scalar. Aggregate the rows values of the data matrix to
windowequally sized slices on the data range using the method defined inaggregation. If negative, apply a running window of sizewindowSizeusing the same aggregation method. Alternatively, the special valueautocauses the function to determine the optimal window size to avoid overplotting, andfixeduses fixed-size windows of sizewindowSize.windowSize=NULL:Numeric scalar. The size of the running window when the value of
windowis negative.ylim=NULL:Numeric vector of length 2. The range of the y-axis scale.
yTicksAt=NULL:Numeric vector. The points at which y-axis tick-marks are to be drawn. By default, when
NULL, tickmark locations are computed.
Inherited from class GdObject:
alpha=1:Numeric scalar. The transparency for all track items.
alpha.title=NULL:Numeric scalar. The transparency for the title panel.
background.panel="transparent":Integer or character scalar. The background color of the content panel.
background.title="lightgray":Integer or character scalar. The background color for the title panel.
background.legend="transparent":Integer or character scalar. The background color for the legend.
cex.axis=NULL:Numeric scalar. The expansion factor for the axis annotation. Defaults to
NULL, in which case it is automatically determined based on the available space.cex.title=NULL:Numeric scalar. The expansion factor for the title panel. This effects the fontsize of both the title and the axis, if any. Defaults to
NULL, which means that the text size is automatically adjusted to the available space.col.axis="white":Integer or character scalar. The font and line color for the y axis, if any.
col.border.title="white":Integer or character scalar. The border color for the title panels.
col.frame="lightgray":Integer or character scalar. The line color used for the panel frame, if
frame==TRUEcol.grid="#808080":Integer or character scalar. Default line color for grid lines, both when
type=="g"inDataTracks and when display parametergrid==TRUE.col.line=NULL:Integer or character scalar. Default colors for plot lines. Usually the same as the global
colparameter.col.symbol=NULL:Integer or character scalar. Default colors for plot symbols. Usually the same as the global
colparameter.col.title="white":Integer or character scalar. The border color for the title panels
fill="lightgray":Integer or character scalar. Default fill color setting for all plotting elements, unless there is a more specific control defined elsewhere.
fontcolor="black":Integer or character scalar. The font color for all text, unless a more specific definition exists.
fontface.title=2:Integer or character scalar. The font face for the title panels.
fontface=1:Integer or character scalar. The font face for all text, unless a more specific definition exists.
fontfamily.title="sans":Integer or character scalar. The font family for the title panels.
fontfamily="sans":Integer or character scalar. The font family for all text, unless a more specific definition exists.
fontsize=12:Numeric scalar. The font size for all text, unless a more specific definition exists.
frame=FALSE:Boolean. Draw a frame around the track when plotting.
h=-1:Integer scalar. Parameter controlling the number of horizontal grid lines, see
panel.gridfor details.lineheight=1:Numeric scalar. The font line height for all text, unless a more specific definition exists.
lty.grid="solid":Integer or character scalar. Default line type for grid lines, both when
type=="g"inDataTracks and when display parametergrid==TRUE.lty="solid":Numeric scalar. Default line type setting for all plotting elements, unless there is a more specific control defined elsewhere.
lwd.border.title=1:Integer scalar. The border width for the title panels.
lwd.title=1:Integer scalar. The border width for the title panels
lwd.grid=1:Numeric scalar. Default line width for grid lines, both when
type=="g"inDataTracks and when display parametergrid==TRUE.lwd=1:Numeric scalar. Default line width setting for all plotting elements, unless there is a more specific control defined elsewhere.
min.height=3:Numeric scalar. The minimum range height in pixels to display. All ranges are expanded to this size in order to avoid rendering issues. See
collapsingfor details.min.width=1:Numeric scalar. The minimum range width in pixels to display. All ranges are expanded to this size in order to avoid rendering issues. See
collapsingfor details.reverseStrand=FALSE:Logical scalar. Set up the plotting coordinates in 3' -> 5' direction if
TRUE. This will effectively mirror the plot on the vertical axis.rotation.title=90:The rotation angle for the text in the title panel. Even though this can be adjusted, the automatic resizing of the title panel will currently not work, so use at own risk.
rotation=0:The rotation angle for all text unless a more specific definiton exists.
showAxis=TRUE:Boolean controlling whether to plot a y axis (only applies to track types where axes are implemented).
showTitle=TRUE:Boolean controlling whether to plot a title panel. Although this can be set individually for each track, in multi-track plots as created by
plotTracksthere will still be an empty placeholder in case any of the other tracks include a title. The same holds true for axes. Note that the the title panel background color could be set to transparent in order to completely hide it.v=-1:Integer scalar. Parameter controlling the number of vertical grid lines, see
panel.gridfor details.
- IdeogramTrack:
-
background.title="transparent":Character scalar. The background color for the title panel. Defaults to omit the background.
bevel=0.45:Numeric scalar, between 0 and 1. The level of smoothness for the two ends of the ideogram.
centromereShape="triangle":Character scalar. The shape of the centromere. Only "triangle" or "circle" is accepted. Default to "triangle"
cex.bands=0.7:Numeric scalar. The font expansion factor for the chromosome band identifier text.
cex=0.8:Numeric scalar. The overall font expansion factor for the chromosome name text.
col="red":Character scalar. The border color used for the highlighting of the currently displayed genomic region.
col.border.title="transparent":Integer or character scalar. The border color for the title panels.
lwd.border.title=1:Integer scalar. The border width for the title panels.
fill="#FFE3E6":Character scalar. The fill color used for the highlighting of the currently displayed genomic region.
fontface=1:Character scalar. The font face for the chromosome name text.
fontfamily="sans":Character scalar. The font family for the chromosome name text.
fontcolor="#808080":Character scalar. The font color for the chromosome name text.
fontsize=10:Numeric scalar. The font size for the chromosome name text.
outline=FALSE:Logical scalar. Add borders to the individual chromosome staining bands.
showBandId=FALSE:Logical scalar. Show the identifier for the chromosome bands if there is space for it.
lty=1:Character or integer scalar. The line type used for the highlighting of the currently displayed genomic region.
lwd=1:Numeric scalar. The line width used for the highlighting of the currently displayed genomic region.
showId=TRUE:Logical scalar. Indicate the chromosome name next to the ideogram.
showTitle=FALSE:Logical scalar. Plot a title panel. Defaults to omit the title panel.
size=NULL:Numeric scalar. The relative size of the track. Defaults to automatic size setting. Can also be overridden in the
plotTracksfunction.
Inherited from class GdObject:
alpha=1:Numeric scalar. The transparency for all track items.
alpha.title=NULL:Numeric scalar. The transparency for the title panel.
background.panel="transparent":Integer or character scalar. The background color of the content panel.
background.legend="transparent":Integer or character scalar. The background color for the legend.
cex.axis=NULL:Numeric scalar. The expansion factor for the axis annotation. Defaults to
NULL, in which case it is automatically determined based on the available space.cex.title=NULL:Numeric scalar. The expansion factor for the title panel. This effects the fontsize of both the title and the axis, if any. Defaults to
NULL, which means that the text size is automatically adjusted to the available space.col.axis="white":Integer or character scalar. The font and line color for the y axis, if any.
col.frame="lightgray":Integer or character scalar. The line color used for the panel frame, if
frame==TRUEcol.grid="#808080":Integer or character scalar. Default line color for grid lines, both when
type=="g"inDataTracks and when display parametergrid==TRUE.col.line=NULL:Integer or character scalar. Default colors for plot lines. Usually the same as the global
colparameter.col.symbol=NULL:Integer or character scalar. Default colors for plot symbols. Usually the same as the global
colparameter.col.title="white":Integer or character scalar. The border color for the title panels
collapse=TRUE:Boolean controlling whether to collapse the content of the track to accomodate the minimum current device resolution. See
collapsingfor details.fontface.title=2:Integer or character scalar. The font face for the title panels.
fontfamily.title="sans":Integer or character scalar. The font family for the title panels.
frame=FALSE:Boolean. Draw a frame around the track when plotting.
grid=FALSE:Boolean, switching on/off the plotting of a grid.
h=-1:Integer scalar. Parameter controlling the number of horizontal grid lines, see
panel.gridfor details.lineheight=1:Numeric scalar. The font line height for all text, unless a more specific definition exists.
lty.grid="solid":Integer or character scalar. Default line type for grid lines, both when
type=="g"inDataTracks and when display parametergrid==TRUE.lwd.title=1:Integer scalar. The border width for the title panels
lwd.grid=1:Numeric scalar. Default line width for grid lines, both when
type=="g"inDataTracks and when display parametergrid==TRUE.min.distance=1:Numeric scalar. The minimum pixel distance before collapsing range items, only if
collapse==TRUE. Seecollapsingfor details.min.height=3:Numeric scalar. The minimum range height in pixels to display. All ranges are expanded to this size in order to avoid rendering issues. See
collapsingfor details.min.width=1:Numeric scalar. The minimum range width in pixels to display. All ranges are expanded to this size in order to avoid rendering issues. See
collapsingfor details.reverseStrand=FALSE:Logical scalar. Set up the plotting coordinates in 3' -> 5' direction if
TRUE. This will effectively mirror the plot on the vertical axis.rotation.title=90:The rotation angle for the text in the title panel. Even though this can be adjusted, the automatic resizing of the title panel will currently not work, so use at own risk.
rotation=0:The rotation angle for all text unless a more specific definiton exists.
showAxis=TRUE:Boolean controlling whether to plot a y axis (only applies to track types where axes are implemented).
v=-1:Integer scalar. Parameter controlling the number of vertical grid lines, see
panel.gridfor details.
- AnnotationTrack:
-
arrowHeadWidth=30:Numeric scalar. The width of the arrow head in pixels if
shapeisfixedArrow.arrowHeadMaxWidth=40:Numeric scalar. The maximum width of the arrow head in pixels if
shapeisarrow.cex.group=0.6:Numeric scalar. The font expansion factor for the group-level annotation.
cex=1:Numeric scalar. The font expansion factor for item identifiers.
col.line="darkgray":Character scalar. The color used for connecting lines between grouped items. Defaults to a light gray, but if set to
NULLthe same color as for the first item in the group is used.col="transparent":Character or integer scalar. The border color for all track items.
featureAnnotation=NULL:Character scalar. Add annotation information to the individual track elements. This can be a value in
id,grouporfeature. Defaults toid. Only works ifshowFeatureIdis notFALSE.fill="lightblue":Character or integer scalar. The fill color for untyped items. This is also used to connect grouped items. See
groupingfor details.fontfamily.group="sans":Character scalar. The font family for the group-level annotation.
fontcolor.group="#808080":Character or integer scalar. The font color for the group-level annotation.
fontcolor.item="white":Character or integer scalar. The font color for item identifiers.
fontface.group=2:Numeric scalar. The font face for the group-level annotation.
fontsize.group=12:Numeric scalar. The font size for the group-level annotation.
groupAnnotation=NULL:Character scalar. Add annotation information as group labels. This can be a value in
id,grouporfeature. Defaults togroup. Only works ifshowIdis notFALSE.just.group="left":Character scalar. the justification of group labels. Either
left,right,aboveorbelow.lex=1:Numeric scalar. The line expansion factor for all track items. This is also used to connect grouped items. See
groupingfor details.lineheight=1:Numeric scalar. The font line height for item identifiers.
lty="solid":Character or integer scalar. The line type for all track items. This is also used to connect grouped items. See
groupingfor details.lwd=1:Integer scalar. The line width for all track items. This is also used to connect grouped items. See
groupingfor details.mergeGroups=FALSE:Logical scalar. Merge fully overlapping groups if
collapse==TRUE.min.height=3:Numeric scalar. The minimum range height in pixels to display. All ranges are expanded to this size in order to avoid rendering issues. See
collapsingfor details. For feathered bars indicating the strandedness of grouped items this also controls the height of the arrow feathers.min.width=1:Numeric scalar. The minimum range width in pixels to display. All ranges are expanded to this size in order to avoid rendering issues. See
collapsingfor details.rotation=0:Numeric scalar. The degree of text rotation for item identifiers.
rotation.group=0:Numeric scalar. The degree of text rotation for group labels.
rotation.item=0:Numeric scalar. The degree of text rotation for item identifiers.
shape="arrow":Character scalar. The shape in which to display the track items. Currently only
box,arrow,fixedArrow,ellipse, andsmallArroware implemented.showFeatureId=FALSE:Logical scalar. Control whether to plot the individual track item identifiers.
showId=FALSE:Logical scalar. Control whether to annotate individual groups.
showOverplotting=FALSE:Logical scalar. Use a color gradient to show the amount of overplotting for collapsed items. This implies that
collapse==TRUEsize=1:Numeric scalar. The relative size of the track. Can be overridden in the
plotTracksfunction.
Inherited from class StackedTrack:
stackHeight=0.75:Numeric between 0 and 1. Controls the vertical size and spacing between stacked elements. The number defines the proportion of the total available space for the stack that is used to draw the glyphs. E.g., a value of 0.5 means that half of the available vertical drawing space (for each stacking line) is used for the glyphs, and thus one quarter of the available space each is used for spacing above and below the glyph. Defaults to 0.75.
reverseStacking=FALSE:Logical flag. Reverse the y-ordering of stacked items. I.e., features that are plotted on the bottom-most stacks will be moved to the top-most stack and vice versa.
Inherited from class GdObject:
alpha=1:Numeric scalar. The transparency for all track items.
alpha.title=NULL:Numeric scalar. The transparency for the title panel.
background.panel="transparent":Integer or character scalar. The background color of the content panel.
background.title="lightgray":Integer or character scalar. The background color for the title panel.
background.legend="transparent":Integer or character scalar. The background color for the legend.
cex.axis=NULL:Numeric scalar. The expansion factor for the axis annotation. Defaults to
NULL, in which case it is automatically determined based on the available space.cex.title=NULL:Numeric scalar. The expansion factor for the title panel. This effects the fontsize of both the title and the axis, if any. Defaults to
NULL, which means that the text size is automatically adjusted to the available space.col.axis="white":Integer or character scalar. The font and line color for the y axis, if any.
col.border.title="white":Integer or character scalar. The border color for the title panels.
col.frame="lightgray":Integer or character scalar. The line color used for the panel frame, if
frame==TRUEcol.grid="#808080":Integer or character scalar. Default line color for grid lines, both when
type=="g"inDataTracks and when display parametergrid==TRUE.col.symbol=NULL:Integer or character scalar. Default colors for plot symbols. Usually the same as the global
colparameter.col.title="white":Integer or character scalar. The border color for the title panels
collapse=TRUE:Boolean controlling whether to collapse the content of the track to accomodate the minimum current device resolution. See
collapsingfor details.fontcolor="black":Integer or character scalar. The font color for all text, unless a more specific definition exists.
fontface.title=2:Integer or character scalar. The font face for the title panels.
fontface=1:Integer or character scalar. The font face for all text, unless a more specific definition exists.
fontfamily.title="sans":Integer or character scalar. The font family for the title panels.
fontfamily="sans":Integer or character scalar. The font family for all text, unless a more specific definition exists.
fontsize=12:Numeric scalar. The font size for all text, unless a more specific definition exists.
frame=FALSE:Boolean. Draw a frame around the track when plotting.
grid=FALSE:Boolean, switching on/off the plotting of a grid.
h=-1:Integer scalar. Parameter controlling the number of horizontal grid lines, see
panel.gridfor details.lty.grid="solid":Integer or character scalar. Default line type for grid lines, both when
type=="g"inDataTracks and when display parametergrid==TRUE.lwd.border.title=1:Integer scalar. The border width for the title panels.
lwd.title=1:Integer scalar. The border width for the title panels
lwd.grid=1:Numeric scalar. Default line width for grid lines, both when
type=="g"inDataTracks and when display parametergrid==TRUE.min.distance=1:Numeric scalar. The minimum pixel distance before collapsing range items, only if
collapse==TRUE. Seecollapsingfor details.reverseStrand=FALSE:Logical scalar. Set up the plotting coordinates in 3' -> 5' direction if
TRUE. This will effectively mirror the plot on the vertical axis.rotation.title=90:The rotation angle for the text in the title panel. Even though this can be adjusted, the automatic resizing of the title panel will currently not work, so use at own risk.
showAxis=TRUE:Boolean controlling whether to plot a y axis (only applies to track types where axes are implemented).
showTitle=TRUE:Boolean controlling whether to plot a title panel. Although this can be set individually for each track, in multi-track plots as created by
plotTracksthere will still be an empty placeholder in case any of the other tracks include a title. The same holds true for axes. Note that the the title panel background color could be set to transparent in order to completely hide it.v=-1:Integer scalar. Parameter controlling the number of vertical grid lines, see
panel.gridfor details.
- GeneRegionTrack:
-
arrowHeadWidth=10:Numeric scalar. The width of the arrow head in pixels if
shapeisfixedArrow.arrowHeadMaxWidth=20:Numeric scalar. The maximum width of the arrow head in pixels if
shapeisarrow.col=NULL:Character or integer scalar. The border color for all track items. Defaults to using the same color as in
fill, also taking into account different trackfeatures.collapseTranscripts=FALSE:Logical or character scalar. Can be one in
gene,longest,shortestormeta. Merge all transcripts of the same gene into one single gene model. In the case ofgene(orTRUE), this will only keep the start location of the first exon and the end location of the last exon from all transcripts of the gene. Forshortestandlongest, only the longest or shortest transcript model is retained. Formeta, a meta-transcript containing the union of all exons is formed (essentially identical to the operationreduce(geneModel)).exonAnnotation=NULL:Character scalar. Add annotation information to the individual exon models. This can be a value in
symbol,gene,transcript,exonorfeature. Defaults toexon. Only works ifshowExonIdis notFALSE.fill="orange":Character or integer scalar. The fill color for untyped items. This is also used to connect grouped items. See
groupingfor details.min.distance=0:Numeric scalar. The minimum pixel distance before collapsing range items, only if
collapse==TRUE. Seecollapsingfor details. Note that a value larger than 0 may lead to UTR regions being merged to CDS regions, which in most cases is not particularly useful.shape=c("smallArrow", "box"):Character scalar. The shape in which to display the track items. Currently only
box,arrow,ellipse, andsmallArroware implemented.showExonId=NULL:Logical scalar. Control whether to plot the individual exon identifiers.
thinBoxFeature=c("utr", "ncRNA", "utr3", "utr5", "3UTR", "5UTR", "miRNA", "lincRNA", "three_prime_UTR", "five_prime_UTR"):Character vector. A listing of feature types that should be drawn with thin boxes. Typically those are non-coding elements.
transcriptAnnotation=NULL:Character scalar. Add annotation information as transcript labels. This can be a value in
symbol,gene,transcript,exonorfeature. Defaults tosymbol. Only works ifshowIdis notFALSE.
Inherited from class AnnotationTrack:
cex.group=0.6:Numeric scalar. The font expansion factor for the group-level annotation.
cex=1:Numeric scalar. The font expansion factor for item identifiers.
col.line="darkgray":Character scalar. The color used for connecting lines between grouped items. Defaults to a light gray, but if set to
NULLthe same color as for the first item in the group is used.featureAnnotation=NULL:Character scalar. Add annotation information to the individual track elements. This can be a value in
id,grouporfeature. Defaults toid. Only works ifshowFeatureIdis notFALSE.fontfamily.group="sans":Character scalar. The font family for the group-level annotation.
fontcolor.group="#808080":Character or integer scalar. The font color for the group-level annotation.
fontcolor.item="white":Character or integer scalar. The font color for item identifiers.
fontface.group=2:Numeric scalar. The font face for the group-level annotation.
fontsize.group=12:Numeric scalar. The font size for the group-level annotation.
groupAnnotation=NULL:Character scalar. Add annotation information as group labels. This can be a value in
id,grouporfeature. Defaults togroup. Only works ifshowIdis notFALSE.just.group="left":Character scalar. the justification of group labels. Either
left,right,aboveorbelow.lex=1:Numeric scalar. The line expansion factor for all track items. This is also used to connect grouped items. See
groupingfor details.lineheight=1:Numeric scalar. The font line height for item identifiers.
lty="solid":Character or integer scalar. The line type for all track items. This is also used to connect grouped items. See
groupingfor details.lwd=1:Integer scalar. The line width for all track items. This is also used to connect grouped items. See
groupingfor details.mergeGroups=FALSE:Logical scalar. Merge fully overlapping groups if
collapse==TRUE.min.height=3:Numeric scalar. The minimum range height in pixels to display. All ranges are expanded to this size in order to avoid rendering issues. See
collapsingfor details. For feathered bars indicating the strandedness of grouped items this also controls the height of the arrow feathers.min.width=1:Numeric scalar. The minimum range width in pixels to display. All ranges are expanded to this size in order to avoid rendering issues. See
collapsingfor details.rotation=0:Numeric scalar. The degree of text rotation for item identifiers.
rotation.group=0:Numeric scalar. The degree of text rotation for group labels.
rotation.item=0:Numeric scalar. The degree of text rotation for item identifiers.
showFeatureId=FALSE:Logical scalar. Control whether to plot the individual track item identifiers.
showId=FALSE:Logical scalar. Control whether to annotate individual groups.
showOverplotting=FALSE:Logical scalar. Use a color gradient to show the amount of overplotting for collapsed items. This implies that
collapse==TRUEsize=1:Numeric scalar. The relative size of the track. Can be overridden in the
plotTracksfunction.
Inherited from class StackedTrack:
stackHeight=0.75:Numeric between 0 and 1. Controls the vertical size and spacing between stacked elements. The number defines the proportion of the total available space for the stack that is used to draw the glyphs. E.g., a value of 0.5 means that half of the available vertical drawing space (for each stacking line) is used for the glyphs, and thus one quarter of the available space each is used for spacing above and below the glyph. Defaults to 0.75.
reverseStacking=FALSE:Logical flag. Reverse the y-ordering of stacked items. I.e., features that are plotted on the bottom-most stacks will be moved to the top-most stack and vice versa.
Inherited from class GdObject:
alpha=1:Numeric scalar. The transparency for all track items.
alpha.title=NULL:Numeric scalar. The transparency for the title panel.
background.panel="transparent":Integer or character scalar. The background color of the content panel.
background.title="lightgray":Integer or character scalar. The background color for the title panel.
background.legend="transparent":Integer or character scalar. The background color for the legend.
cex.axis=NULL:Numeric scalar. The expansion factor for the axis annotation. Defaults to
NULL, in which case it is automatically determined based on the available space.cex.title=NULL:Numeric scalar. The expansion factor for the title panel. This effects the fontsize of both the title and the axis, if any. Defaults to
NULL, which means that the text size is automatically adjusted to the available space.col.axis="white":Integer or character scalar. The font and line color for the y axis, if any.
col.border.title="white":Integer or character scalar. The border color for the title panels.
col.frame="lightgray":Integer or character scalar. The line color used for the panel frame, if
frame==TRUEcol.grid="#808080":Integer or character scalar. Default line color for grid lines, both when
type=="g"inDataTracks and when display parametergrid==TRUE.col.symbol=NULL:Integer or character scalar. Default colors for plot symbols. Usually the same as the global
colparameter.col.title="white":Integer or character scalar. The border color for the title panels
collapse=TRUE:Boolean controlling whether to collapse the content of the track to accomodate the minimum current device resolution. See
collapsingfor details.fontcolor="black":Integer or character scalar. The font color for all text, unless a more specific definition exists.
fontface.title=2:Integer or character scalar. The font face for the title panels.
fontface=1:Integer or character scalar. The font face for all text, unless a more specific definition exists.
fontfamily.title="sans":Integer or character scalar. The font family for the title panels.
fontfamily="sans":Integer or character scalar. The font family for all text, unless a more specific definition exists.
fontsize=12:Numeric scalar. The font size for all text, unless a more specific definition exists.
frame=FALSE:Boolean. Draw a frame around the track when plotting.
grid=FALSE:Boolean, switching on/off the plotting of a grid.
h=-1:Integer scalar. Parameter controlling the number of horizontal grid lines, see
panel.gridfor details.lty.grid="solid":Integer or character scalar. Default line type for grid lines, both when
type=="g"inDataTracks and when display parametergrid==TRUE.lwd.border.title=1:Integer scalar. The border width for the title panels.
lwd.title=1:Integer scalar. The border width for the title panels
lwd.grid=1:Numeric scalar. Default line width for grid lines, both when
type=="g"inDataTracks and when display parametergrid==TRUE.reverseStrand=FALSE:Logical scalar. Set up the plotting coordinates in 3' -> 5' direction if
TRUE. This will effectively mirror the plot on the vertical axis.rotation.title=90:The rotation angle for the text in the title panel. Even though this can be adjusted, the automatic resizing of the title panel will currently not work, so use at own risk.
showAxis=TRUE:Boolean controlling whether to plot a y axis (only applies to track types where axes are implemented).
showTitle=TRUE:Boolean controlling whether to plot a title panel. Although this can be set individually for each track, in multi-track plots as created by
plotTracksthere will still be an empty placeholder in case any of the other tracks include a title. The same holds true for axes. Note that the the title panel background color could be set to transparent in order to completely hide it.v=-1:Integer scalar. Parameter controlling the number of vertical grid lines, see
panel.gridfor details.
- BiomartGeneRegionTrack:
-
C_segment="burlywood4":Character or integer scalar. Fill color for annotation objects of type 'C_segment'.
D_segment="lightblue":Character or integer scalar. Fill color for annotation objects of type 'C_segment'.
J_segment="dodgerblue2":Character or integer scalar. Fill color for annotation objects of type 'C_segment'.
Mt_rRNA="yellow":Character or integer scalar. Fill color for annotation objects of type 'Mt_rRNA'.
Mt_tRNA="darkgoldenrod":Character or integer scalar. Fill color for annotation objects of type 'Mt_tRNA'.
Mt_tRNA_pseudogene="darkgoldenrod1":Character or integer scalar. Fill color for annotation objects of type 'Mt_tRNA_pseudogene'.
V_segment="aquamarine":Character or integer scalar. Fill color for annotation objects of type 'V_segment'.
miRNA="cornflowerblue":Character or integer scalar. Fill color for annotation objects of type 'L_segment'.
miRNA_pseudogene="cornsilk":Character or integer scalar. Fill color for annotation objects of type 'miRNA_pseudogene'.
misc_RNA="cornsilk3":Character or integer scalar. Fill color for annotation objects of type 'misc_RNA'.
misc_RNA_pseudogene="cornsilk4":Character or integer scalar. Fill color for annotation objects of type 'misc_RNA_pseudogene'.
protein_coding="#FFD58A":Character or integer scalar. Fill color for annotation objects of type 'protein_coding'.
pseudogene="brown1":Character or integer scalar. Fill color for annotation objects of type 'pseudogene'.
rRNA="darkolivegreen1":Character or integer scalar. Fill color for annotation objects of type 'rRNA'.
rRNA_pseudogene="darkolivegreen":Character or integer scalar. Fill color for annotation objects of type 'rRNA_pseudogene'.
retrotransposed="blueviolet":Character or integer scalar. Fill color for annotation objects of type 'retrotransposed'.
scRNA="gold4":Character or integer scalar. Fill color for annotation objects of type 'scRNA'.
scRNA_pseudogene="darkorange2":Character or integer scalar. Fill color for annotation objects of type 'scRNA_pseudogene'.
snRNA="coral":Character or integer scalar. Fill color for annotation objects of type 'snRNA'.
snRNA_pseudogene="coral3":Character or integer scalar. Fill color for annotation objects of type 'snRNA_pseudogene'.
snoRNA="cyan":Character or integer scalar. Fill color for annotation objects of type 'snoRNA'.
snoRNA_pseudogene="cyan2":Character or integer scalar. Fill color for annotation objects of type 'snoRNA_pseudogene'.
tRNA_pseudogene="antiquewhite3":Character or integer scalar. Fill color for annotation objects of type 'tRNA_pseudogene'.
utr3="#FFD58A":Character or integer scalar. Fill color for annotation objects of type 'utr3'.
utr5="#FFD58A":Character or integer scalar. Fill color for annotation objects of type 'utr5'.
verbose=FALSE:Logical scalar. Report data loading events from Bioamart or retrieval from cache.
Inherited from class GeneRegionTrack:
arrowHeadWidth=10:Numeric scalar. The width of the arrow head in pixels if
shapeisfixedArrow.arrowHeadMaxWidth=20:Numeric scalar. The maximum width of the arrow head in pixels if
shapeisarrow.col=NULL:Character or integer scalar. The border color for all track items. Defaults to using the same color as in
fill, also taking into account different trackfeatures.collapseTranscripts=FALSE:Logical or character scalar. Can be one in
gene,longest,shortestormeta. Merge all transcripts of the same gene into one single gene model. In the case ofgene(orTRUE), this will only keep the start location of the first exon and the end location of the last exon from all transcripts of the gene. Forshortestandlongest, only the longest or shortest transcript model is retained. Formeta, a meta-transcript containing the union of all exons is formed (essentially identical to the operationreduce(geneModel)).exonAnnotation=NULL:Character scalar. Add annotation information to the individual exon models. This can be a value in
symbol,gene,transcript,exonorfeature. Defaults toexon. Only works ifshowExonIdis notFALSE.fill="orange":Character or integer scalar. The fill color for untyped items. This is also used to connect grouped items. See
groupingfor details.min.distance=0:Numeric scalar. The minimum pixel distance before collapsing range items, only if
collapse==TRUE. Seecollapsingfor details. Note that a value larger than 0 may lead to UTR regions being merged to CDS regions, which in most cases is not particularly useful.shape=c("smallArrow", "box"):Character scalar. The shape in which to display the track items. Currently only
box,arrow,ellipse, andsmallArroware implemented.showExonId=NULL:Logical scalar. Control whether to plot the individual exon identifiers.
thinBoxFeature=c("utr", "ncRNA", "utr3", "utr5", "3UTR", "5UTR", "miRNA", "lincRNA", "three_prime_UTR", "five_prime_UTR"):Character vector. A listing of feature types that should be drawn with thin boxes. Typically those are non-coding elements.
transcriptAnnotation=NULL:Character scalar. Add annotation information as transcript labels. This can be a value in
symbol,gene,transcript,exonorfeature. Defaults tosymbol. Only works ifshowIdis notFALSE.
Inherited from class AnnotationTrack:
cex.group=0.6:Numeric scalar. The font expansion factor for the group-level annotation.
cex=1:Numeric scalar. The font expansion factor for item identifiers.
col.line="darkgray":Character scalar. The color used for connecting lines between grouped items. Defaults to a light gray, but if set to
NULLthe same color as for the first item in the group is used.featureAnnotation=NULL:Character scalar. Add annotation information to the individual track elements. This can be a value in
id,grouporfeature. Defaults toid. Only works ifshowFeatureIdis notFALSE.fontfamily.group="sans":Character scalar. The font family for the group-level annotation.
fontcolor.group="#808080":Character or integer scalar. The font color for the group-level annotation.
fontcolor.item="white":Character or integer scalar. The font color for item identifiers.
fontface.group=2:Numeric scalar. The font face for the group-level annotation.
fontsize.group=12:Numeric scalar. The font size for the group-level annotation.
groupAnnotation=NULL:Character scalar. Add annotation information as group labels. This can be a value in
id,grouporfeature. Defaults togroup. Only works ifshowIdis notFALSE.just.group="left":Character scalar. the justification of group labels. Either
left,right,aboveorbelow.lex=1:Numeric scalar. The line expansion factor for all track items. This is also used to connect grouped items. See
groupingfor details.lineheight=1:Numeric scalar. The font line height for item identifiers.
lty="solid":Character or integer scalar. The line type for all track items. This is also used to connect grouped items. See
groupingfor details.lwd=1:Integer scalar. The line width for all track items. This is also used to connect grouped items. See
groupingfor details.mergeGroups=FALSE:Logical scalar. Merge fully overlapping groups if
collapse==TRUE.min.height=3:Numeric scalar. The minimum range height in pixels to display. All ranges are expanded to this size in order to avoid rendering issues. See
collapsingfor details. For feathered bars indicating the strandedness of grouped items this also controls the height of the arrow feathers.min.width=1:Numeric scalar. The minimum range width in pixels to display. All ranges are expanded to this size in order to avoid rendering issues. See
collapsingfor details.rotation=0:Numeric scalar. The degree of text rotation for item identifiers.
rotation.group=0:Numeric scalar. The degree of text rotation for group labels.
rotation.item=0:Numeric scalar. The degree of text rotation for item identifiers.
showFeatureId=FALSE:Logical scalar. Control whether to plot the individual track item identifiers.
showId=FALSE:Logical scalar. Control whether to annotate individual groups.
showOverplotting=FALSE:Logical scalar. Use a color gradient to show the amount of overplotting for collapsed items. This implies that
collapse==TRUEsize=1:Numeric scalar. The relative size of the track. Can be overridden in the
plotTracksfunction.
Inherited from class StackedTrack:
stackHeight=0.75:Numeric between 0 and 1. Controls the vertical size and spacing between stacked elements. The number defines the proportion of the total available space for the stack that is used to draw the glyphs. E.g., a value of 0.5 means that half of the available vertical drawing space (for each stacking line) is used for the glyphs, and thus one quarter of the available space each is used for spacing above and below the glyph. Defaults to 0.75.
reverseStacking=FALSE:Logical flag. Reverse the y-ordering of stacked items. I.e., features that are plotted on the bottom-most stacks will be moved to the top-most stack and vice versa.
Inherited from class GdObject:
alpha=1:Numeric scalar. The transparency for all track items.
alpha.title=NULL:Numeric scalar. The transparency for the title panel.
background.panel="transparent":Integer or character scalar. The background color of the content panel.
background.title="lightgray":Integer or character scalar. The background color for the title panel.
background.legend="transparent":Integer or character scalar. The background color for the legend.
cex.axis=NULL:Numeric scalar. The expansion factor for the axis annotation. Defaults to
NULL, in which case it is automatically determined based on the available space.cex.title=NULL:Numeric scalar. The expansion factor for the title panel. This effects the fontsize of both the title and the axis, if any. Defaults to
NULL, which means that the text size is automatically adjusted to the available space.col.axis="white":Integer or character scalar. The font and line color for the y axis, if any.
col.border.title="white":Integer or character scalar. The border color for the title panels.
col.frame="lightgray":Integer or character scalar. The line color used for the panel frame, if
frame==TRUEcol.grid="#808080":Integer or character scalar. Default line color for grid lines, both when
type=="g"inDataTracks and when display parametergrid==TRUE.col.symbol=NULL:Integer or character scalar. Default colors for plot symbols. Usually the same as the global
colparameter.col.title="white":Integer or character scalar. The border color for the title panels
collapse=TRUE:Boolean controlling whether to collapse the content of the track to accomodate the minimum current device resolution. See
collapsingfor details.fontcolor="black":Integer or character scalar. The font color for all text, unless a more specific definition exists.
fontface.title=2:Integer or character scalar. The font face for the title panels.
fontface=1:Integer or character scalar. The font face for all text, unless a more specific definition exists.
fontfamily.title="sans":Integer or character scalar. The font family for the title panels.
fontfamily="sans":Integer or character scalar. The font family for all text, unless a more specific definition exists.
fontsize=12:Numeric scalar. The font size for all text, unless a more specific definition exists.
frame=FALSE:Boolean. Draw a frame around the track when plotting.
grid=FALSE:Boolean, switching on/off the plotting of a grid.
h=-1:Integer scalar. Parameter controlling the number of horizontal grid lines, see
panel.gridfor details.lty.grid="solid":Integer or character scalar. Default line type for grid lines, both when
type=="g"inDataTracks and when display parametergrid==TRUE.lwd.border.title=1:Integer scalar. The border width for the title panels.
lwd.title=1:Integer scalar. The border width for the title panels
lwd.grid=1:Numeric scalar. Default line width for grid lines, both when
type=="g"inDataTracks and when display parametergrid==TRUE.reverseStrand=FALSE:Logical scalar. Set up the plotting coordinates in 3' -> 5' direction if
TRUE. This will effectively mirror the plot on the vertical axis.rotation.title=90:The rotation angle for the text in the title panel. Even though this can be adjusted, the automatic resizing of the title panel will currently not work, so use at own risk.
showAxis=TRUE:Boolean controlling whether to plot a y axis (only applies to track types where axes are implemented).
showTitle=TRUE:Boolean controlling whether to plot a title panel. Although this can be set individually for each track, in multi-track plots as created by
plotTracksthere will still be an empty placeholder in case any of the other tracks include a title. The same holds true for axes. Note that the the title panel background color could be set to transparent in order to completely hide it.v=-1:Integer scalar. Parameter controlling the number of vertical grid lines, see
panel.gridfor details.
- AlignmentsTrack:
-
alpha.reads=0.5:Numeric scalar between 0 and 1. The transparency of the individual read icons. Can be used to indicate overlapping regions in read pairs. Only on supported devices.
alpha.mismatch=1:Numeric scalar between 0 and 1. The transparency of the mismatch base information.
cex=0.7:Numeric Scalar. The global character expansion factor.
cex.mismatch=NULL:Numeric Scalar. The character expansion factor for the mismatch base letters.
col.coverage=NULL:Integer or character scalar. The line color for the coverage profile.
col.gap="#808080":Integer or character scalar. The color of the line that is bridging the gap regions in gapped alignments.
col.mates="#E0E0E0":Integer or character scalar. The color of the line that is connecting two paired reads.
col.deletion="#000000":Integer or character scalar. The color of the line that is bridging the deleted regions in alignments.
col.insertion="#984EA3":Integer or character scalar. The color of the line that highlighting insertions in alignments.
col.mismatch="#808080":Integer or character scalar. The box color around mismatch bases.
col.reads=NULL:Integer or character scalar. The box color around reads.
col.sashimi=NULL:Integer or character scalar. The line color for sashimi plots.
col="#808080":Integer or character scalar. The default color of all line elements.
collapse=FALSE:Logical scalar. Do not perform any collapsing of overlapping elements. Currently not supported.
coverageHeight=0.1:Numeric scalar. The height of the coverage region of the track. Can either be a value between 0 and 1 in which case it is taken as a relative height, or a positive value greater 1 in which case it is interpreted as pixels.
fill.coverage=NULL:Integer or character scalar. The fill color for the coverage profile.
fill.reads=NULL:Integer or character scalar. The fill color for the read icons.
fill="#BABABA":Integer or character scalar. The default fill color of all plot elements.
fontface.mismatch=2:Integer scalar. The font face for mismatch bases.
lty.coverage=NULL:Integer or character scalar. The line type of the coverage profile.
lty.gap=NULL:Integer or character scalar. The type of the line that is bridging the gap regions in gapped alignments.
lty.mates=NULL:Integer or character scalar. The type of the line that is connecting two paired reads.
lty.deletion=NULL:Integer or character scalar. The type of the line that is bridging the deleted regions in alignments.
lty.insertion=NULL:Integer or character scalar. The type of the line that highlighting insertions in alignments.
lty.mismatch=NULL:Integer or character scalar. The box line type around mismatch bases.
lty.reads=NULL:Integer or character scalar. The box line type around mismatch reads.
lty=1:Integer or character scalar. The default type of all line elements.
lwd.coverage=NULL:Integer or character scalar. The line width of the coverage profile.
lwd.gap=NULL:Integer scalar. The width of the line that is bridging the gap regions in gapped alignments.
lwd.mates=NULL:Integer scalar. The width of the line that is connecting two paired reads.
lwd.deletion=NULL:Integer scalar. The width of the line that is bridging the deleted regions in alignments.
lwd.insertion=NULL:Integer scalar. The width of the line that highlighting insertions in alignments.
lwd.mismatch=NULL:Integer scalar. The box line width around mismatch bases.
lwd.reads=NULL:Integer scalar. The box line width around reads.
lwd.sashimiMax=10:Integer scalar. The maximal width of the line in sashimi plots.
lwd=1:Integer scalar. The default width of all line elements.
max.height=10:Integer scalar. The maximum height of an individual read in pixels. Can be used in combination with
min.heightto control the read and stacking appearance.min.height=5:Integer scalar. The minimum height of an individual read in pixels. Can be used in combination with
max.heightto control the read and stacking appearance.minCoverageHeight=50:Integer scalar. The minimum height of the coverage section. Uselful in combination with a relative setting of
coverageHeight.minSashimiHeight=50:Integer scalar. The minimum height of the sashimi section. Uselful in combination with a relative setting of
sashimiHeight.noLetters=FALSE:Logical scalar. Always plot colored boxes for mismatch bases regardles of the available space.
sashimiFilter=NULL:GRanges object. Only junctions which overlap equally with
sashimiFilterGRanges are shown. DefaultNULL, no filtering.sashimiFilterTolerance=0:Integer scalar. Only used in combination with
sashimiFilter. It allows to include junctions whose starts/ends are within specified distance fromsashimiFilterGRanges. This is useful for cases where the aligner did not place the junction reads precisely. Default0L, no tolerance.sashimiHeight=0.1:Integer scalar. The height of the sashimi part of the track. Can either be a value between 0 and 1 in which case it is taken as a relative height, or a positive value greater 1 in which case it is interpreted as pixels.
sashimiScore=1:Integer scalar. The minimum number of reads supporting the junction.
sashimiStrand="*":Integer scalar. Only reads which have the specified strand are considered to count the junctions.
sashimiTransformation=NULL:Function. Applied to the junction score vector prior to plotting. The function should accept exactly one input argument and its return value needs to be a numeric vector of identical length as the input data.
showIndels=FALSE:Logical scalar. Consider insertions and deletions in coverage and pile-up. Default is
FALSE. If set toTRUEthe deletions defined in CIGAR string are not considered in coverage plot. The deletions are displayed as bridging lines in pile-up track. Insertions are shown as vertical bars.showMismatches=TRUE:Logical scalar. Add mismatch information, either as individual base letters or using color coded bars. This implies that the reference sequence has been provided, either to the class constructor or as part of the track list.
size=NULL:Numeric scalar. The size of the track. Defaults to automatic sizing.
transformation=NULL:Function. Applied to the coverage vector prior to plotting. The function should accept exactly one input argument and its return value needs to be a numeric Rle of identical length as the input data.
type=c("coverage", "pileup"):Character vactor. The type of information to plot. For
coveragea coverage plot, potentially augmented by base mismatch information, forsashimia sashimi plot, showing the juctions, and forpileupthe pileups of the individual reads. These three can be combined.
Inherited from class StackedTrack:
stackHeight=0.75:Numeric between 0 and 1. Controls the vertical size and spacing between stacked elements. The number defines the proportion of the total available space for the stack that is used to draw the glyphs. E.g., a value of 0.5 means that half of the available vertical drawing space (for each stacking line) is used for the glyphs, and thus one quarter of the available space each is used for spacing above and below the glyph. Defaults to 0.75.
reverseStacking=FALSE:Logical flag. Reverse the y-ordering of stacked items. I.e., features that are plotted on the bottom-most stacks will be moved to the top-most stack and vice versa.
Inherited from class GdObject:
alpha=1:Numeric scalar. The transparency for all track items.
alpha.title=NULL:Numeric scalar. The transparency for the title panel.
background.panel="transparent":Integer or character scalar. The background color of the content panel.
background.title="lightgray":Integer or character scalar. The background color for the title panel.
background.legend="transparent":Integer or character scalar. The background color for the legend.
cex.axis=NULL:Numeric scalar. The expansion factor for the axis annotation. Defaults to
NULL, in which case it is automatically determined based on the available space.cex.title=NULL:Numeric scalar. The expansion factor for the title panel. This effects the fontsize of both the title and the axis, if any. Defaults to
NULL, which means that the text size is automatically adjusted to the available space.col.axis="white":Integer or character scalar. The font and line color for the y axis, if any.
col.border.title="white":Integer or character scalar. The border color for the title panels.
col.frame="lightgray":Integer or character scalar. The line color used for the panel frame, if
frame==TRUEcol.grid="#808080":Integer or character scalar. Default line color for grid lines, both when
type=="g"inDataTracks and when display parametergrid==TRUE.col.line=NULL:Integer or character scalar. Default colors for plot lines. Usually the same as the global
colparameter.col.symbol=NULL:Integer or character scalar. Default colors for plot symbols. Usually the same as the global
colparameter.col.title="white":Integer or character scalar. The border color for the title panels
fontcolor="black":Integer or character scalar. The font color for all text, unless a more specific definition exists.
fontface.title=2:Integer or character scalar. The font face for the title panels.
fontface=1:Integer or character scalar. The font face for all text, unless a more specific definition exists.
fontfamily.title="sans":Integer or character scalar. The font family for the title panels.
fontfamily="sans":Integer or character scalar. The font family for all text, unless a more specific definition exists.
fontsize=12:Numeric scalar. The font size for all text, unless a more specific definition exists.
frame=FALSE:Boolean. Draw a frame around the track when plotting.
grid=FALSE:Boolean, switching on/off the plotting of a grid.
h=-1:Integer scalar. Parameter controlling the number of horizontal grid lines, see
panel.gridfor details.lineheight=1:Numeric scalar. The font line height for all text, unless a more specific definition exists.
lty.grid="solid":Integer or character scalar. Default line type for grid lines, both when
type=="g"inDataTracks and when display parametergrid==TRUE.lwd.border.title=1:Integer scalar. The border width for the title panels.
lwd.title=1:Integer scalar. The border width for the title panels
lwd.grid=1:Numeric scalar. Default line width for grid lines, both when
type=="g"inDataTracks and when display parametergrid==TRUE.min.distance=1:Numeric scalar. The minimum pixel distance before collapsing range items, only if
collapse==TRUE. Seecollapsingfor details.min.width=1:Numeric scalar. The minimum range width in pixels to display. All ranges are expanded to this size in order to avoid rendering issues. See
collapsingfor details.reverseStrand=FALSE:Logical scalar. Set up the plotting coordinates in 3' -> 5' direction if
TRUE. This will effectively mirror the plot on the vertical axis.rotation.title=90:The rotation angle for the text in the title panel. Even though this can be adjusted, the automatic resizing of the title panel will currently not work, so use at own risk.
rotation=0:The rotation angle for all text unless a more specific definiton exists.
showAxis=TRUE:Boolean controlling whether to plot a y axis (only applies to track types where axes are implemented).
showTitle=TRUE:Boolean controlling whether to plot a title panel. Although this can be set individually for each track, in multi-track plots as created by
plotTracksthere will still be an empty placeholder in case any of the other tracks include a title. The same holds true for axes. Note that the the title panel background color could be set to transparent in order to completely hide it.v=-1:Integer scalar. Parameter controlling the number of vertical grid lines, see
panel.gridfor details.
See also
Examples
## Which scheme is used?
getOption("Gviz.scheme")
#> [1] "default"
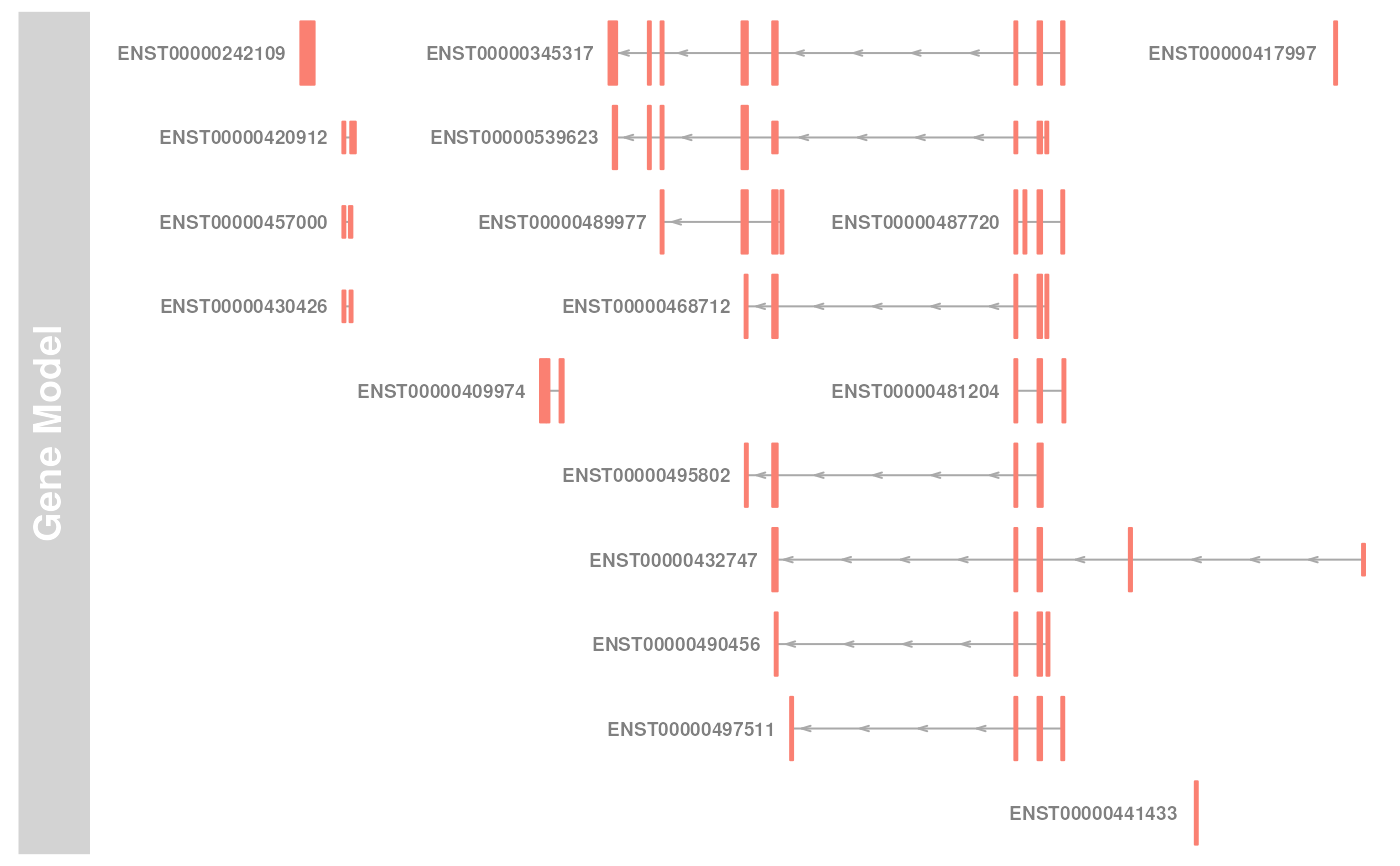
## Change default settings for GeneRegionTrack
scheme <- getScheme()
scheme$GeneRegionTrack$fill <- "salmon"
scheme$GeneRegionTrack$col <- NULL
scheme$GeneRegionTrack$transcriptAnnotation <- "transcript"
## replace default scheme with myScheme
addScheme(scheme, "myScheme")
options(Gviz.scheme = "myScheme")
getOption("Gviz.scheme")
#> [1] "myScheme"
data(geneModels)
grtrack <- GeneRegionTrack(geneModels, genome = "hg19", chromosome = "chr7", name = "Gene Model")
plotTracks(grtrack)