The virtual parent class for all track items in the Gviz package. This
class definition contains all the common entities that are needed for a
track to be plotted. During object instantiation for any of the sub-classes
inheriting from GdObject, this class' global initializer has to be
called in order to assure that all necessary settings are present.
# S4 method for class 'GdObject'
initialize(.Object, name, ...)

# S4 method for class 'GdObject,character'
setPar(x, name, value, interactive = TRUE)

# S4 method for class 'GdObject,list'
setPar(x, value, interactive = TRUE)

# S4 method for class 'GdObject,list'
displayPars(x, recursive = FALSE) <- value

# S4 method for class 'GdObject,character'
getPar(x, name, asIs = FALSE)

# S4 method for class 'GdObject,missing'
getPar(x, hideInternal = TRUE)

# S4 method for class 'GdObject,character'
displayPars(x, name)

# S4 method for class 'GdObject,missing'
displayPars(x, hideInternal = TRUE)

# S4 method for class 'GdObject'
coords(ImageMap)

# S4 method for class 'GdObject'
tags(ImageMap)

# S4 method for class 'GdObject'
subset(x, ...)

# S4 method for class 'GdObject'
names(x)

# S4 method for class 'GdObject,character'
names(x) <- value

group(GdObject, ...)

group(GdObject) <- value

# S4 method for class 'GdObject'
group(GdObject)

imageMap(GdObject, ...)

# S4 method for class 'GdObject'
imageMap(GdObject)

imageMap(GdObject) <- value

# S4 method for class 'GdObject,ImageMapOrNULL'
imageMap(GdObject) <- value

drawAxis(GdObject, ...)

# S4 method for class 'GdObject'
drawAxis(GdObject, ...)

drawGrid(GdObject, ...)

drawGD(GdObject, ...)

gene(GdObject, ...)

gene(GdObject) <- value

symbol(GdObject, ...)

symbol(GdObject) <- value

transcript(GdObject, ...)

transcript(GdObject) <- value

exon(GdObject, ...)

exon(GdObject) <- value

feature(GdObject, ...)

feature(GdObject) <- value

identifier(GdObject, ...)

identifier(GdObject) <- value

chromosome(GdObject, ...)

# S4 method for class 'GdObject'
chromosome(GdObject)

chromosome(GdObject) <- value

# S4 method for class 'GdObject'
chromosome(GdObject) <- value

position(GdObject, ...)

# S4 method for class 'GdObject'
genome(x)

# S4 method for class 'GdObject'
genome(x) <- value

consolidateTrack(GdObject, ...)

# S4 method for class 'GdObject'
consolidateTrack(GdObject, alpha, ...)

stacking(GdObject, ...)

stacking(GdObject) <- value

stacks(GdObject, ...)

setStacks(GdObject, ...)

# S4 method for class 'GdObject'
setStacks(GdObject, ...)

setCoverage(GdObject, ...)
Arguments
- name
Name of the retrieved parameter.
- ...
Additional arguments.
- x
A valid track object class name, or the object itself, in which case the class is derived directly from it.
- value
Value to be set.
- interactive
logical- recursive
logical- asIs
logical- hideInternal
logical- ImageMap
Object of
ImageMap-class, containing optional information for an HTML image map.- GdObject
Object of
GdObject-class.
Value
A virtual class: No objects may be created from it.
Details
Display Parameters
The following display parameters are set for objects of class GdObject
upon instantiation, unless one or more of them have already been set by
one of the optional sub-class initializers, which always get precedence
over these global defaults. See settings for details on setting
graphical parameters for tracks.
alpha=1Numeric scalar. The transparency for all track items.alpha.title=NULLNumeric scalar. The transparency for the title panel.background.legend="transparent"Integer or character scalar. The background colour for the legend.background.panel="transparent"Integer or character scalar. The background colour of the content panel.background.title="lightgray"Integer or character scalar. The background colour for the title panel.cex=1Numeric scalar. The overall font expansion factor for all text and glyphs, unless a more specific definition exists.cex.axis=NULLNumeric scalar. The expansion factor for the axis annotation. Defaults toNULL, in which case it is automatically determined based on the available space.cex.title=NULLNumeric scalar. The expansion factor for the title panel. This effects the font size of both the title and the axis, if any. Defaults to NULL, which means that the text size is automatically adjusted to the available space.col="#0080FF"Integer or character scalar. Default line colour setting for all plotting elements, unless there is a more specific control defined elsewhere.col.axis="white"Integer or character scalar. The font and line colour for the y axis, if any.col.border.title="white"Integer or character scalar. The border colour for the title panels.col.frame="lightgray"Integer or character scalar. The line colour used for the panel frame, ifframe==TRUEcol.grid="#808080"Integer or character scalar. Default line colour for grid lines, both whentype=="g"inDataTracks and when display parametergrid==TRUE.col.line=NULLInteger or character scalar. Default colours for plot lines. Usually the same as the global col parameter.col.symbol=NULLInteger or character scalar. Default colours for plot symbols. Usually the same as the global col parameter.col.title="white"(Aliasesfontcolour.title) Integer or character scalar. The border colour for the title panelscollapse=TRUEBoolean controlling whether to collapse the content of the track to accommodate the minimum current device resolution. See collapsing for details.fill="lightgray"Integer or character scalar. Default fill colour setting for all plotting elements, unless there is a more specific control defined elsewhere.fontcolour="black"Integer or character scalar. The font colour for all text, unless a more specific definition exists.fontface=1Integer or character scalar. The font face for all text, unless a more specific definition exists.fontface.title=2Integer or character scalar. The font face for the title panels.fontfamily="sans"Integer or character scalar. The font family for all text, unless a more specific definition exists.fontfamily.title="sans"Integer or character scalar. The font family for the title panels.fontsize=12Numeric scalar. The font size for all text, unless a more specific definition exists.frame=FALSEBoolean. Draw a frame around the track when plotting.grid=FALSEBoolean, switching on/off the plotting of a grid.h=-1Integer scalar. Parameter controlling the number of horizontal grid lines, see panel.grid for details.lineheight=1Numeric scalar. The font line height for all text, unless a more specific definition exists.lty="solid"Numeric scalar. Default line type setting for all plotting elements, unless there is a more specific control defined elsewhere.lty.grid="solid"Integer or character scalar. Default line type for grid lines, both whentype=="g"inDataTracks and when display parametergrid==TRUE.lwd=1Numeric scalar. Default line width setting for all plotting elements, unless there is a more specific control defined elsewhere.lwd.border.title=1Integer scalar. The border width for the title panels.lwd.grid=1Numeric scalar. Default line width for grid lines, both whentype=="g"inDataTracks and when display parametergrid==TRUE.lwd.title=1Integer scalar. The border width for the title panelsmin.distance=1Numeric scalar. The minimum pixel distance before collapsing range items, only ifcollapse==TRUE. See collapsing for details.min.height=3Numeric scalar. The minimum range height in pixels to display. All ranges are expanded to this size in order to avoid rendering issues. See collapsing for details.min.width=1Numeric scalar. The minimum range width in pixels to display. All ranges are expanded to this size in order to avoid rendering issues. See collapsing for details.reverseStrand=FALSELogical scalar. Set up the plotting coordinates in 3' -> 5' direction ifTRUE.This will effectively mirror the plot on the vertical axis.rotation=0The rotation angle for all text unless a more specific definition exists.rotation.title=90(Aliases rotation.title) The rotation angle for the text in the title panel. Even though this can be adjusted, the automatic resizing of the title panel will currently not work, so use at own risk.showAxis=TRUEBoolean controlling whether to plot a y axis (only applies to track types where axes are implemented).showTitle=TRUEBoolean controlling whether to plot a title panel. Although this can be set individually for each track, in multi-track plots as created byplotTracksthere will still be an empty place holder in case any of the other tracks include a title. The same holds true for axes. Note that the the title panel background colour could be set to transparent in order to completely hide it.size=1Numeric scalar. The relative size of the track. Can be overridden in theplotTracksfunction.v=-1Integer scalar. Parameter controlling the number of vertical grid lines, see panel.grid for details....additional display parameters are allowed. Those typically take the value of a valid R colour descriptors. The parameter names will later be matched to optional track item types as defined in the 'feature' range attribute, and all tracks of the matched types are coloured accordingly. See the documentation of theGeneRegionTrackandAnnotationTrackclasses as well as grouping for details.
Functions
initialize(GdObject): Initialize the object. This involves setting up a new environment for the display parameters and filling it up with the current settings. All arguments that have not been clobbered up by one of the sub-class initializers are considered to be additional display parameters and are also added to the environment. Seesettingsfor details on setting graphical parameters for tracks.setPar(x = GdObject, value = character): set the single display parameter name to value. Note that display parameters in theGdObject-classare pass-by-reference, so no re-assignment to the symbolobjis necessary. See settings for details on display parameters and customization.setPar(x = GdObject, value = list): set display parameters by the values of the named list in value. Note that display parameters in theGdObject-classare pass-by-reference, so no re-assignment to the symbolobjis necessary. See settings for details on display parameters and customization.displayPars(x = GdObject) <- value: set display parameters using the values of the named list invalue. Seesettingsfor details on display parameters and customization.getPar(x = GdObject, name = character): alias for thedisplayParsmethod. Seesettingsfor details on display parameters and customization.getPar(x = GdObject, name = missing): alias for thedisplayParsmethod. Seesettingsfor details on display parameters and customization.displayPars(x = GdObject, name = character): list the value of the display parameter name. Seesettingsfor details on display parameters and customization.displayPars(x = GdObject, name = missing): list the value of all available display parameters. Seesettingsfor details on display parameters and customization.coords(GdObject): return the coordinates from the internal image map.tags(GdObject): return the tags from the internal image map.subset(GdObject): subset aGdObjectby coordinates. Most of the respective sub-classes inheriting fromGdObjectoverwrite this method, the default is to return the unaltered input object.names(GdObject): return the value of thenameslot.names(x = GdObject) <- value: set the value of thenameslot.group(): Generics forgroup.group(GdObject) <- value: Generics forgroup<-.group(GdObject): return grouping information for the individual items in the track. Unless overwritten in one of the sub-classes, this usually returnsNULL.imageMap(): Generics forimageMap.imageMap(GdObject): Extract the content of theimageMapslot.imageMap(GdObject) <- value: Generics forimageMap<-.imageMap(GdObject = GdObject) <- value: Replace the content of theimageMapslot.drawAxis(): Generics fordrawAxis.drawAxis(GdObject): add a y-axis to the title panel of a track if necessary. Unless overwritten in one of the sub-classes this usually does not plot anything and returnsNULL.drawGrid(): Generics fordrawGrid.drawGD(): Generics fordrawGD.gene(): Generics forgene.gene(GdObject) <- value: Generics forgene<-.symbol(): Generics forsymbol.symbol(GdObject) <- value: Generics forsymbol<-.transcript(): Generics fortranscript.transcript(GdObject) <- value: Generics fortranscript<-.exon(): Generics forexon.exon(GdObject) <- value: Generics forexon<-.feature(): Generics forfeature.feature(GdObject) <- value: Generics forfeature<-.identifier(): Generics foridentifier.identifier(GdObject) <- value: Generics foridentifier<-.chromosome(): Generics forchromosome.chromosome(GdObject): return the chromosome for which the track is defined.chromosome(GdObject) <- value: Generics forchromosome.chromosome(GdObject) <- value: replace the value of the track's chromosome. This has to be a valid UCSC chromosome identifier or an integer or character scalar that can be reasonably coerced into one.position(): Generics forposition.genome(GdObject): return the track's genome.genome(GdObject) <- value: set the track's genome. Usually this has to be a valid UCSC identifier, however this is not formally enforced here.consolidateTrack(): Generics forconsolidateTrack.consolidateTrack(GdObject): Consolidate. Determine whether there isalphasettings or not, and add this information as the internal display parameter.__hasAlphaSupport.stacking(): Generics forstacking.stacking(GdObject) <- value: Generics forstacking<-.stacks(): Generics forstacks.setStacks(): Generics for “.setStacks(GdObject): set stacks.setCoverage(): Generics for “.
Slots
dpObject of
DisplayPars-class, the display settings controlling the look and feel of a track. See settings for details on setting graphical parameters for tracks.nameObject of class
character, a human-readable name for the track that will be used in the track's annotation panel if necessary.imageMapObject of
ImageMap-class, containing optional information for an HTML image map. This will be created by thedrawGDmethods when the track is plotted to a device and is usually not set by the user.
See also
Examples
## This is a reference class therefore we show below
## an example from AnnotationTrack:
## An empty object
AnnotationTrack()
#> AnnotationTrack 'AnnotationTrack'
#> | genome: NA
#> | active chromosome: chrNA
#> | annotation features: 0
## Construct from individual arguments
st <- c(2000000, 2070000, 2100000, 2160000)
ed <- c(2050000, 2130000, 2150000, 2170000)
str <- c("-", "+", "-", "-")
gr <- c("Group1", "Group2", "Group1", "Group3")
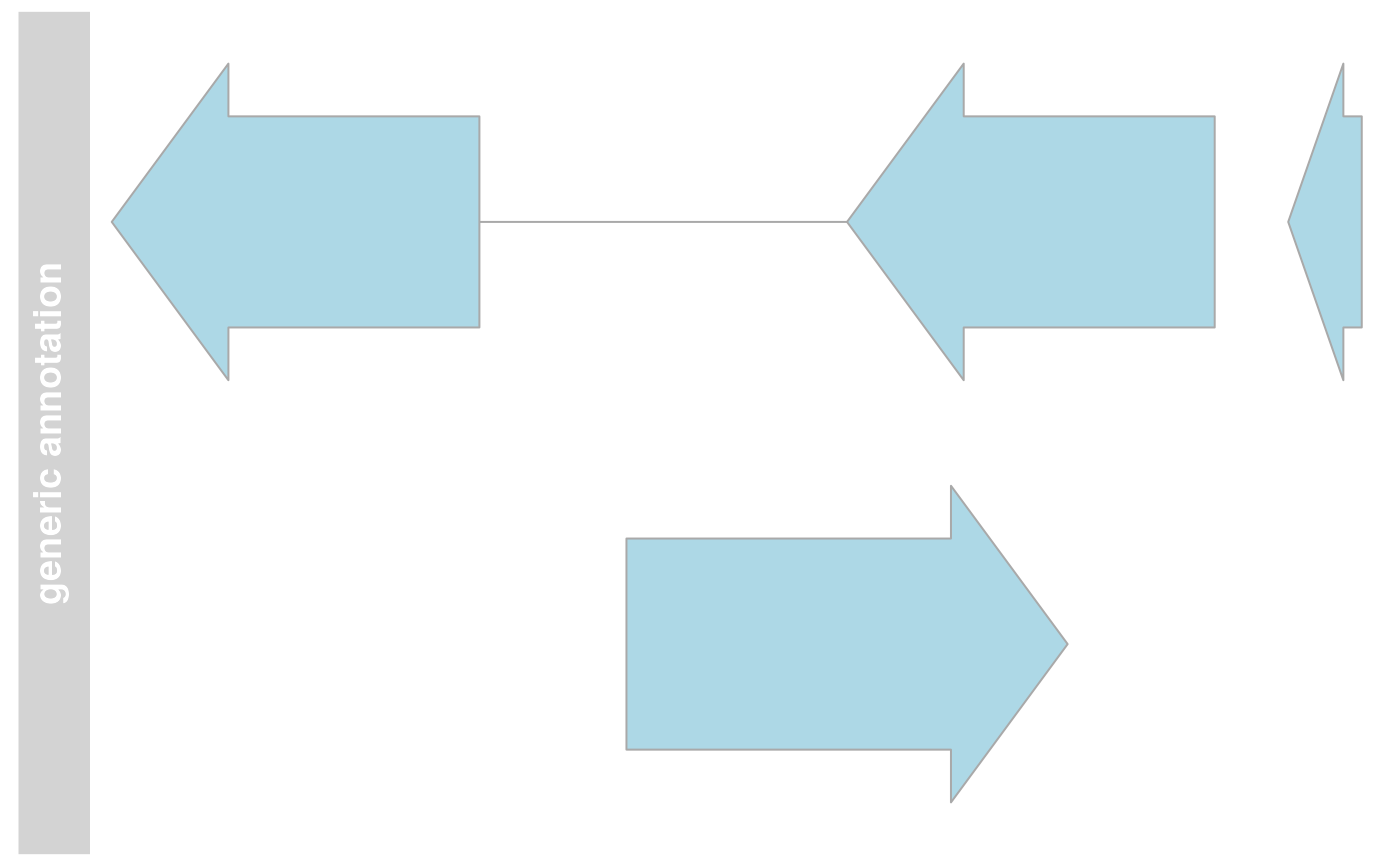
annTrack <- AnnotationTrack(
start = st, end = ed, strand = str, chromosome = 7,
genome = "hg19", feature = "test", group = gr,
id = paste("annTrack item", 1:4),
name = "generic annotation", stacking = "squish"
)
## Plotting
plotTracks(annTrack)