A class representing a customizable genomic axis.
# S4 method for class 'GenomeAxisTrack'
initialize(.Object, range, ids, ...)

GenomeAxisTrack(range = NULL, name = "Axis", id, ...)

# S4 method for class 'GenomeAxisTrack'
ranges(x)

# S4 method for class 'GenomeAxisTrack'
range(x)

# S4 method for class 'GenomeAxisTrack'
start(x)

# S4 method for class 'GenomeAxisTrack'
start(x) <- value

# S4 method for class 'GenomeAxisTrack'
end(x)

# S4 method for class 'GenomeAxisTrack'
end(x) <- value

# S4 method for class 'GenomeAxisTrack'
width(x)

# S4 method for class 'GenomeAxisTrack'
length(x)

# S4 method for class 'GenomeAxisTrack'
values(x)

# S4 method for class 'GenomeAxisTrack'
strand(x)

# S4 method for class 'GenomeAxisTrack'
collapseTrack(
  GdObject,
  min.width = 1,
  min.distance = 0,
  collapse = TRUE,
  diff = .pxResolution(coord = "x"),
  xrange
)

# S4 method for class 'GenomeAxisTrack,ANY,ANY,ANY'
x[i, j, ..., drop = TRUE]

# S4 method for class 'GenomeAxisTrack'
subset(x, from = NULL, to = NULL, sort = FALSE, ...)

# S4 method for class 'GenomeAxisTrack'
drawGD(GdObject, minBase, maxBase, prepare = FALSE, subset = TRUE, ...)

# S4 method for class 'GenomeAxisTrack'
show(object)
Arguments
- range
Optional object of class
GRangesorIRangescontaining regions to be highlighted on the axis by coloured boxes.- ...
Additional items which will all be interpreted as further display parameters. See
settingsand the "Display Parameters" section below for details.- name
Character scalar of the track's name used in the title panel when plotting.
- id
A character vector of the same length as
rangecontaining identifiers for the ranges. If missing, the constructor will try to extract the ids fromnames(range).- x
A valid track object class name, or the object itself, in which case the class is derived directly from it.
Value
The return value of the constructor function is a new object of class
GenomeAxisTrack.
Objects can be created using the constructor function GenomeAxisTrack.
Details
A GenomeAxisTrack can be customized using the familiar display
parameters. By providing a GRanges or IRanges object to the
constructor, ranges on the axis can be further highlighted.
With the scale display parameter, a small scale indicator can be
shown instead of the entire genomic axis. The scale can either be provided
as a fraction of the plotting region (it will be rounded to the nearest
human readable absolute value) or as an absolute value and is always
displayed in bp, kb, mb or gb units. Note that most display parameters for
the GenomeAxisTrack are ignored when a scale is used instead of the
full axis. In particular, only the parameters exponent, alpha,
lwd, col, cex, distFromAxis and labelPos
are used.
Functions
initialize(GenomeAxisTrack): Intialize.GenomeAxisTrack(): Constructorranges(GenomeAxisTrack): return the genomic coordinates for the track along with all additional annotation information as an object of classGRanges.range(GenomeAxisTrack): return the genomic coordinates for the track as an object of classIRanges. @exportstart(GenomeAxisTrack): return the start coordinates of the track items.start(GenomeAxisTrack) <- value: replace the start coordinates of the track items.end(GenomeAxisTrack): return the end coordinates of the track items.end(GenomeAxisTrack) <- value: replace the end coordinates of the track items.width(GenomeAxisTrack): return the with of the track items in genomic coordinates.length(GenomeAxisTrack): return the number of items stored in the ranges slot.values(GenomeAxisTrack): return all additional annotation information except for the genomic coordinates for the track items.strand(GenomeAxisTrack): return a vector of strand specifiers for all track items, in the form '+' for the Watson strand, '-' for the Crick strand or '*' for either of the two.collapseTrack(GenomeAxisTrack): preprocess the track before plotting. This will collapse overlapping track items based on the available resolution and increase the width and height of all track objects to a minimum value to avoid rendering issues. See collapsing for details.x[i: subset the items in theGenomeAxisTrackobject. This is essentially similar to subsetting of theGRangesobject in therangeslot. For most applications, the subset method may be more appropriate.subset(GenomeAxisTrack): plot subset all the contained tracks in anGenomeAxisTrackby coordinates and sort if necessary.drawGD(GenomeAxisTrack): plot the object to a graphics device. The return value of this method is the input object, potentially updated during the plotting operation. Internally, there are two modes in which the method can be called. Either in 'prepare' mode, in which case no plotting is done but the object is preprocessed based on the available space, or in 'plotting' mode, in which case the actual graphical output is created. Since subsetting of the object can be potentially costly, this can be switched off in case subsetting has already been performed before or is not necessary.show(GenomeAxisTrack): Show method.
See also
Examples
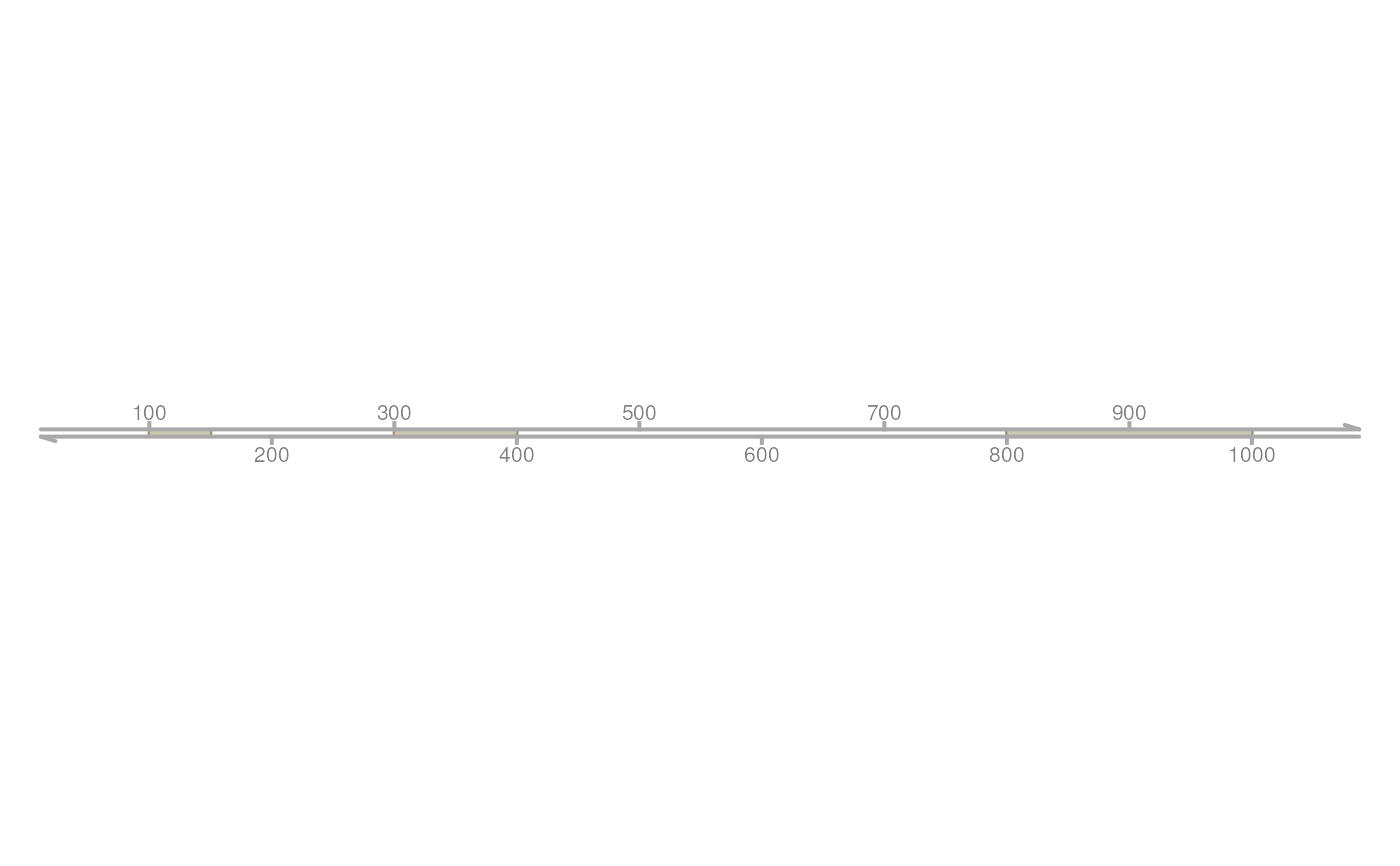
## Construct object
axTrack <- GenomeAxisTrack(
name = "Axis",
range <- IRanges(start = c(100, 300, 800), end = c(150, 400, 1000))
)
## Plotting
plotTracks(axTrack, from = 0, to = 1100)
 ## Track names
names(axTrack)
#> [1] "Axis"
names(axTrack) <- "foo"
## Subsetting and splitting
subTrack <- subset(axTrack, from = 0, to = 500)
length(subTrack)
#> [1] 2
subTrack[1]
#> Genome axis 'foo'
#> There are annotated axis regions:
#> GRanges object with 1 range and 0 metadata columns:
#> seqnames ranges strand
#> <Rle> <IRanges> <Rle>
#> [1] dummy 100-150 *
#> -------
#> seqinfo: 1 sequence from an unspecified genome; no seqlengths
split(axTrack, c(1, 1, 2))
#> $`1`
#> Genome axis 'foo'
#> There are annotated axis regions:
#> GRanges object with 2 ranges and 0 metadata columns:
#> seqnames ranges strand
#> <Rle> <IRanges> <Rle>
#> [1] dummy 100-150 *
#> [2] dummy 300-400 *
#> -------
#> seqinfo: 1 sequence from an unspecified genome; no seqlengths
#>
#> $`2`
#> Genome axis 'foo'
#> There are annotated axis regions:
#> GRanges object with 1 range and 0 metadata columns:
#> seqnames ranges strand
#> <Rle> <IRanges> <Rle>
#> [1] dummy 800-1000 *
#> -------
#> seqinfo: 1 sequence from an unspecified genome; no seqlengths
#>
## Accessors
start(axTrack)
#> [1] 100 300 800
end(axTrack)
#> [1] 150 400 1000
width(axTrack)
#> [1] 51 101 201
strand(axTrack)
#> [1] "*" "*" "*"
range(axTrack)
#> IRanges object with 3 ranges and 0 metadata columns:
#> start end width
#> <integer> <integer> <integer>
#> [1] 100 150 51
#> [2] 300 400 101
#> [3] 800 1000 201
ranges(axTrack)
#> GRanges object with 3 ranges and 0 metadata columns:
#> seqnames ranges strand
#> <Rle> <IRanges> <Rle>
#> [1] dummy 100-150 *
#> [2] dummy 300-400 *
#> [3] dummy 800-1000 *
#> -------
#> seqinfo: 1 sequence from an unspecified genome; no seqlengths
## Annotation
values(axTrack)
#> data frame with 0 columns and 3 rows
## Grouping
group(axTrack)
#> NULL
## HTML image map
coords(axTrack)
#> NULL
tags(axTrack)
#> NULL
axTrack <- plotTracks(axTrack)$foo
## Track names
names(axTrack)
#> [1] "Axis"
names(axTrack) <- "foo"
## Subsetting and splitting
subTrack <- subset(axTrack, from = 0, to = 500)
length(subTrack)
#> [1] 2
subTrack[1]
#> Genome axis 'foo'
#> There are annotated axis regions:
#> GRanges object with 1 range and 0 metadata columns:
#> seqnames ranges strand
#> <Rle> <IRanges> <Rle>
#> [1] dummy 100-150 *
#> -------
#> seqinfo: 1 sequence from an unspecified genome; no seqlengths
split(axTrack, c(1, 1, 2))
#> $`1`
#> Genome axis 'foo'
#> There are annotated axis regions:
#> GRanges object with 2 ranges and 0 metadata columns:
#> seqnames ranges strand
#> <Rle> <IRanges> <Rle>
#> [1] dummy 100-150 *
#> [2] dummy 300-400 *
#> -------
#> seqinfo: 1 sequence from an unspecified genome; no seqlengths
#>
#> $`2`
#> Genome axis 'foo'
#> There are annotated axis regions:
#> GRanges object with 1 range and 0 metadata columns:
#> seqnames ranges strand
#> <Rle> <IRanges> <Rle>
#> [1] dummy 800-1000 *
#> -------
#> seqinfo: 1 sequence from an unspecified genome; no seqlengths
#>
## Accessors
start(axTrack)
#> [1] 100 300 800
end(axTrack)
#> [1] 150 400 1000
width(axTrack)
#> [1] 51 101 201
strand(axTrack)
#> [1] "*" "*" "*"
range(axTrack)
#> IRanges object with 3 ranges and 0 metadata columns:
#> start end width
#> <integer> <integer> <integer>
#> [1] 100 150 51
#> [2] 300 400 101
#> [3] 800 1000 201
ranges(axTrack)
#> GRanges object with 3 ranges and 0 metadata columns:
#> seqnames ranges strand
#> <Rle> <IRanges> <Rle>
#> [1] dummy 100-150 *
#> [2] dummy 300-400 *
#> [3] dummy 800-1000 *
#> -------
#> seqinfo: 1 sequence from an unspecified genome; no seqlengths
## Annotation
values(axTrack)
#> data frame with 0 columns and 3 rows
## Grouping
group(axTrack)
#> NULL
## HTML image map
coords(axTrack)
#> NULL
tags(axTrack)
#> NULL
axTrack <- plotTracks(axTrack)$foo
 coords(axTrack)
#> x1 y1 x2 y2
#> 1 13.75372 227.4 40.22553 276.6
#> 2 119.64095 227.4 172.58457 276.6
#> 3 384.35905 227.4 489.71685 276.6
tags(axTrack)
#> $title
#> 1 2 3
#> "1" "2" "3"
#>
#> $start
#> 1 2 3
#> "100" "300" "800"
#>
#> $end
#> 1 2 3
#> "150" "400" "999"
#>
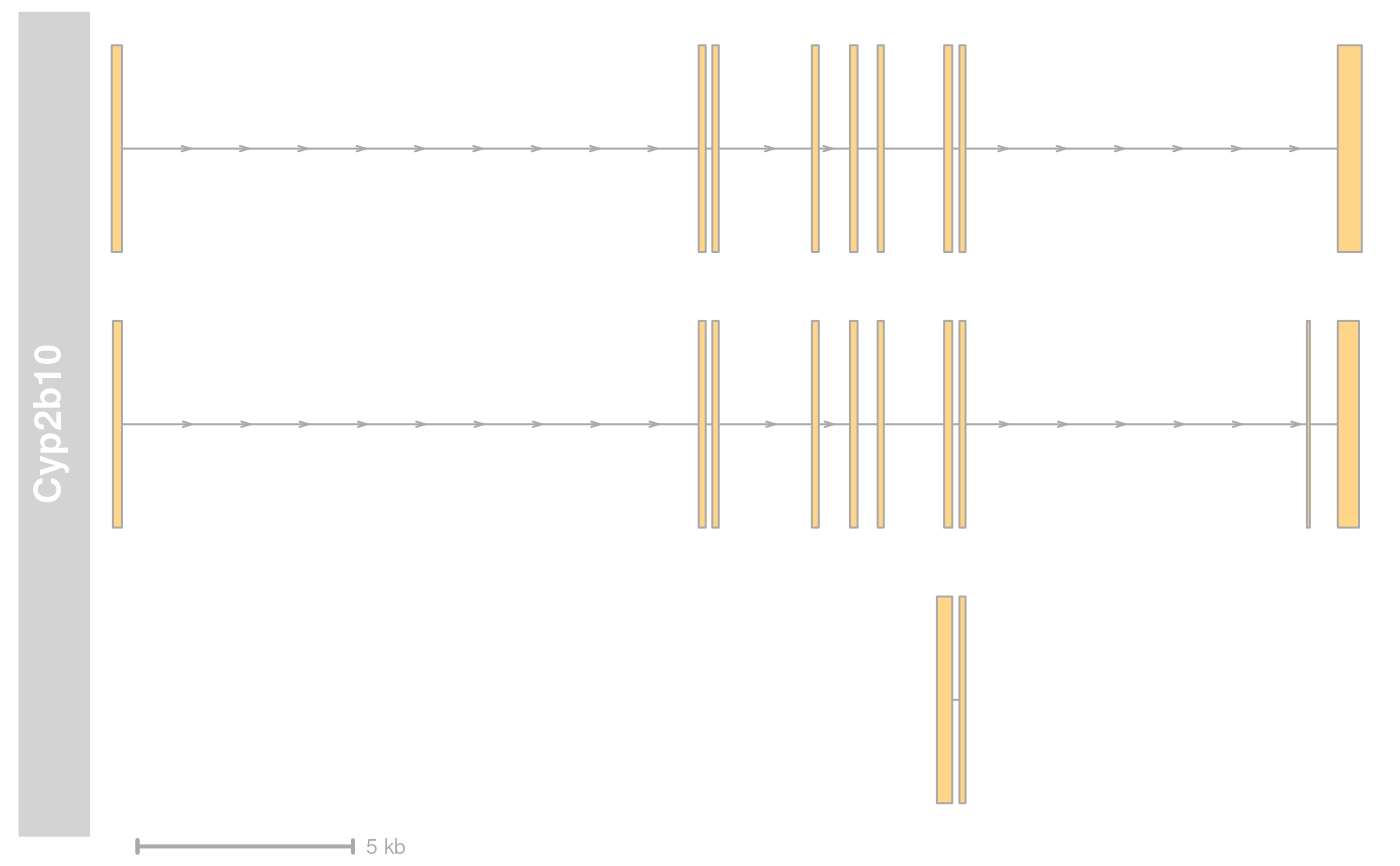
## adding an axis to another track
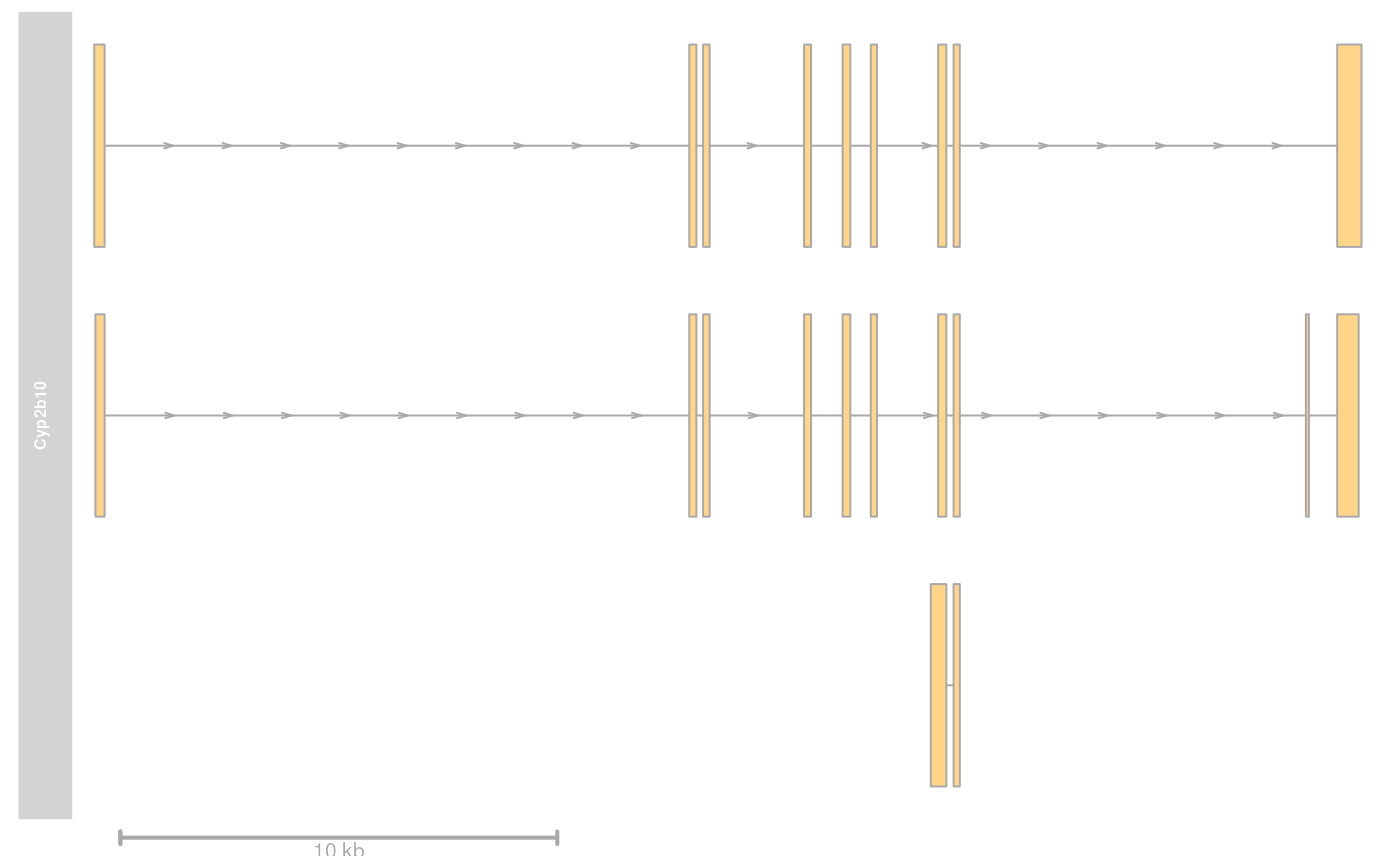
data(cyp2b10)
grTrack <- GeneRegionTrack(
start = 26682683, end = 26711643,
rstart = cyp2b10$start, rends = cyp2b10$end, chromosome = 7, genome = "mm9",
transcript = cyp2b10$transcript, gene = cyp2b10$gene, symbol = cyp2b10$symbol,
name = "Cyp2b10", strand = cyp2b10$strand
)
plotTracks(list(grTrack, GenomeAxisTrack()))
coords(axTrack)
#> x1 y1 x2 y2
#> 1 13.75372 227.4 40.22553 276.6
#> 2 119.64095 227.4 172.58457 276.6
#> 3 384.35905 227.4 489.71685 276.6
tags(axTrack)
#> $title
#> 1 2 3
#> "1" "2" "3"
#>
#> $start
#> 1 2 3
#> "100" "300" "800"
#>
#> $end
#> 1 2 3
#> "150" "400" "999"
#>
## adding an axis to another track
data(cyp2b10)
grTrack <- GeneRegionTrack(
start = 26682683, end = 26711643,
rstart = cyp2b10$start, rends = cyp2b10$end, chromosome = 7, genome = "mm9",
transcript = cyp2b10$transcript, gene = cyp2b10$gene, symbol = cyp2b10$symbol,
name = "Cyp2b10", strand = cyp2b10$strand
)
plotTracks(list(grTrack, GenomeAxisTrack()))
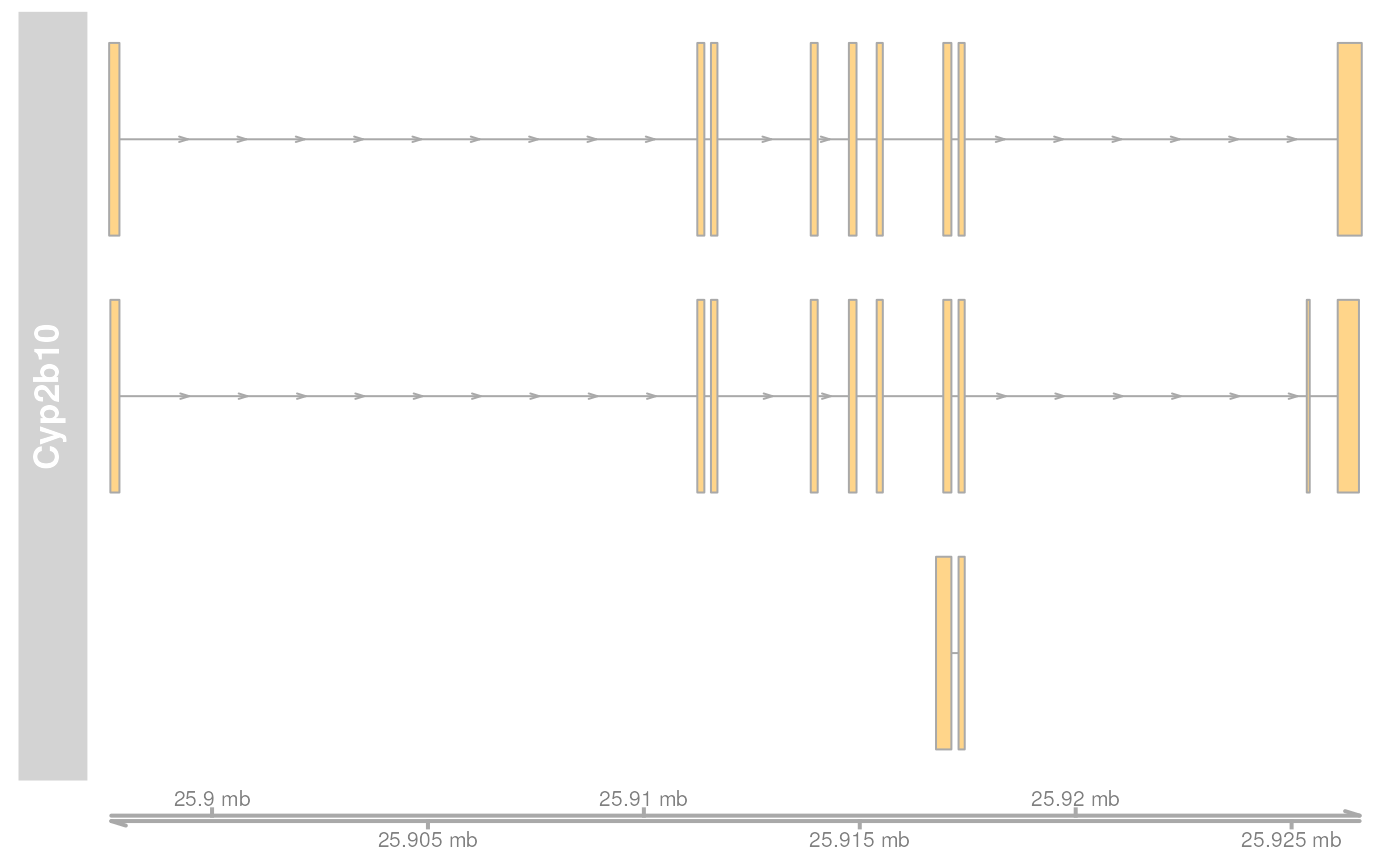 plotTracks(list(grTrack, GenomeAxisTrack(scale = 0.1)))
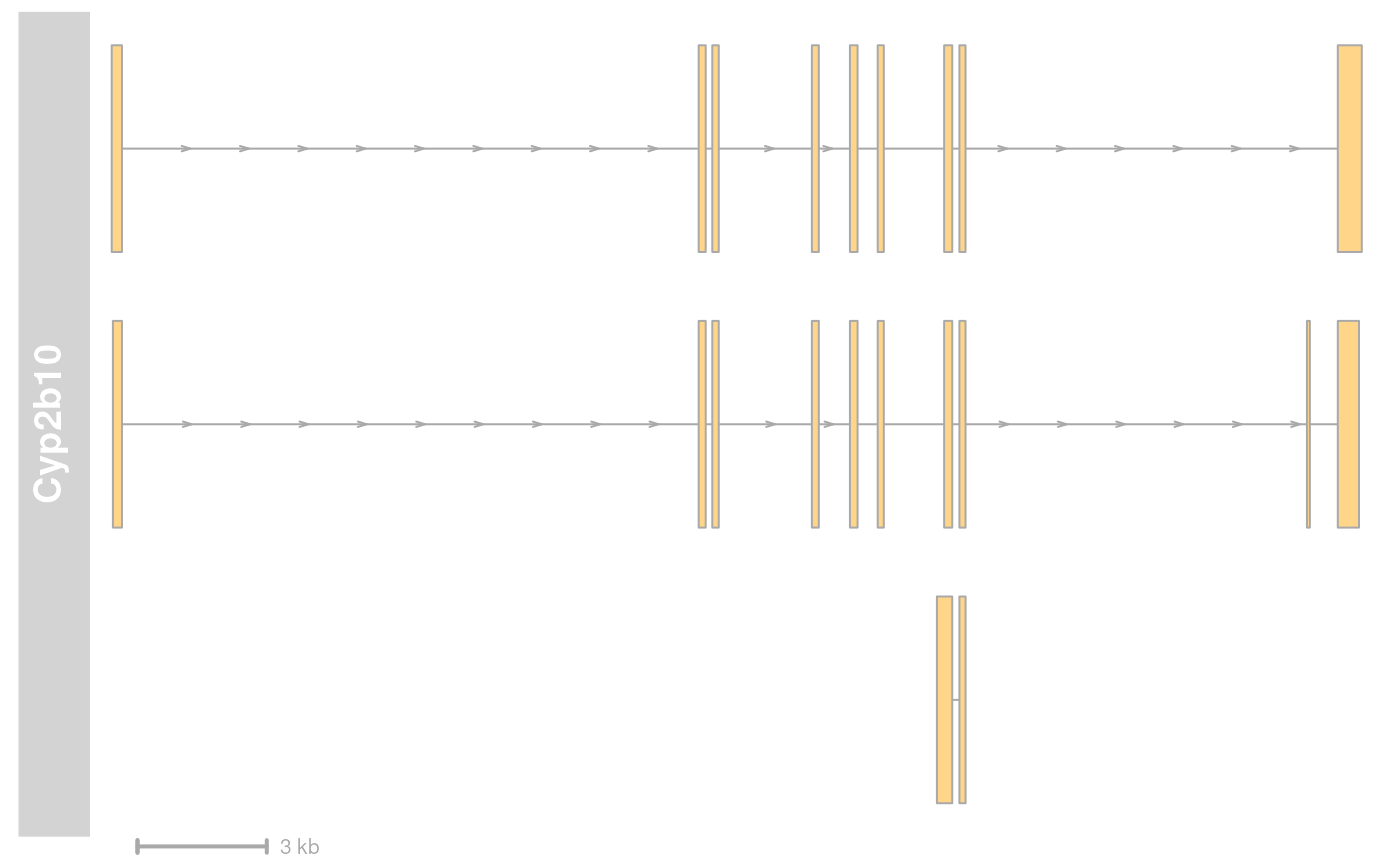 plotTracks(list(grTrack, GenomeAxisTrack(scale = 5000)))
 plotTracks(list(grTrack, GenomeAxisTrack(scale = 0.5, labelPos = "below")))