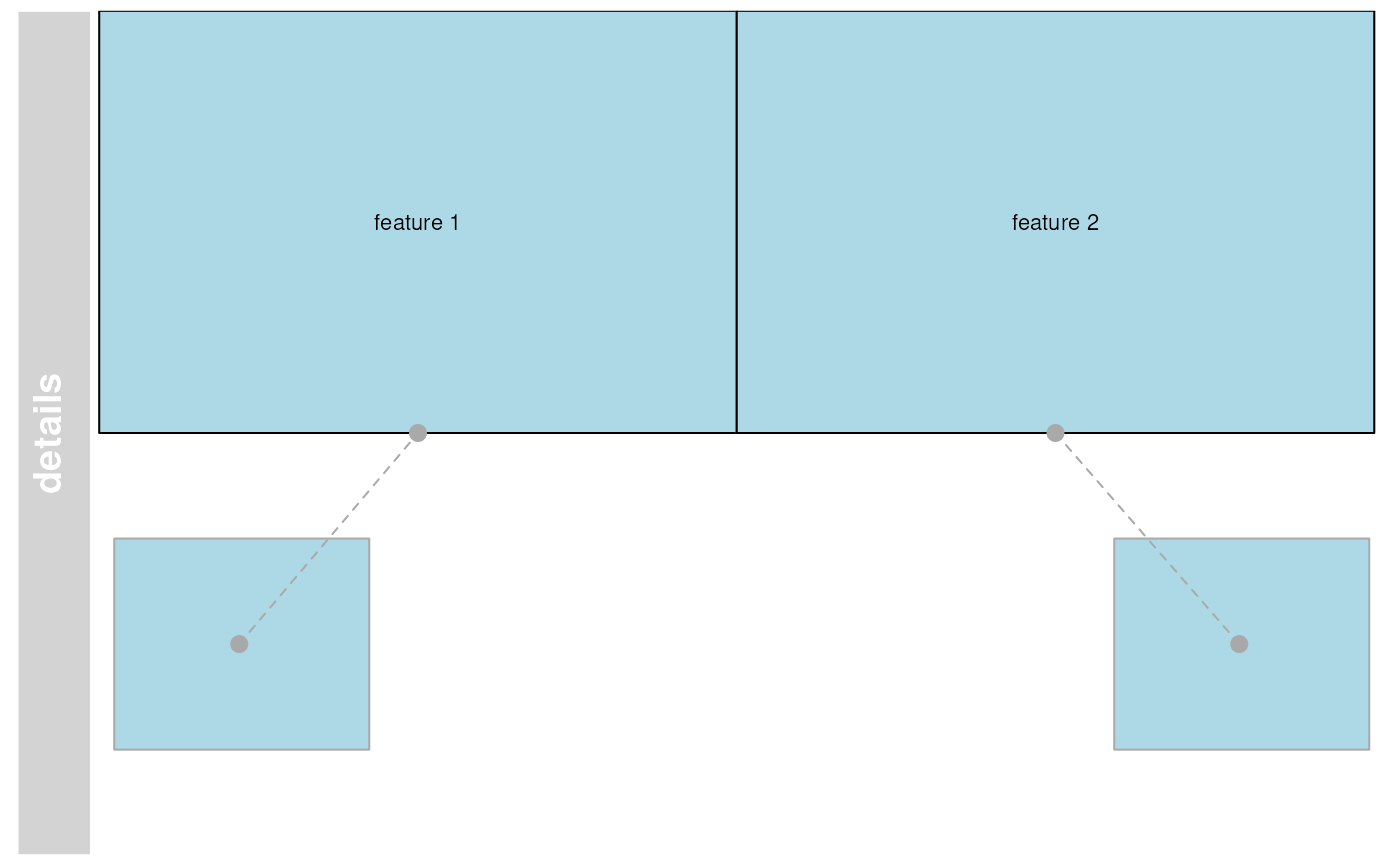
The DetailsAnnotationTrack class directly extends AnnotationTrack
Source: R/AnnotationTrack-class.R
DetailsAnnotationTrack-class.RdThe purpose of this track type is to add an arbitrarily detailed plot
section (typically consisting of additional quantitative data) for each
range element of an AnnotationTrack. See the 'Details' section of the
constructor documentation below for more information.
DetailsAnnotationTrack(...)

# S4 method for class 'DetailsAnnotationTrack'
initialize(.Object, fun, selectFun, ...)

# S4 method for class 'DetailsAnnotationTrack'
drawGD(GdObject, minBase, maxBase, prepare = FALSE, ...)
Arguments
- ...
Additional items which will all be interpreted as further display parameters. See
settingsand the "Display Parameters" section below for details.- .Object
The object skeleton passed on by
new()during class instantiation, to be filled in by theinitializemethod.- fun
A function that is being called for each entry in the
AnnotationTrackobject. See sections 'Details' and 'Examples' for further information. When called internally by the plotting machinery, a number of arguments are automatically passed on to this function, and the user needs to make sure that they can all be digested (i.e., either have all of them as formal named function arguments, or gobble up everything that is not needed in...). These arguments are:start: the genomic start coordinate of the range item.end: the genomic end coordinate of the range item.strand: the strand information for the range item.chromosome: the chromosome of the range item.identifier: the identifier of the range item, i.e., the result of callingidentifier(DetailsAnnotationTrack, lowest=TRUE). Typically those identifiers are passed on to the object constructor during instantiation as theidargument.index: a counter enumerating the ranges. TheAnnotationTrackobject is sorted internally for visibility, and theindexargument refers to the index of plotting.GdObject: a reference to the currently plottedDetailsAnnotationTrackobject.GdObject.original: a reference to theDetailsAnnotationTrackbefore any processing like item collapsing has taken place. Essentially, this is the track object as it exists in your working environment.
Additional arguments can be passed to the plotting function by means of the
detailsFunArgsargument (see below). Note that the plot must use grid graphics (e.g. functions in thelatticepackage or low-level grid functions). To access a data object such as a matrix or data frame within the function you can either store it as a variable in the global environment or, to avoid name space conflicts, you can make it part of the function environment by means of a closure. Alternatively, you may want to explicitly stick it into an environment or pass it along in thedetailsFunArgslist. To figure out in your custom plotting function which annotation element is currently being plotted you can either use the identifier, which has to be unique for each range element, or you may want to use the genomic position (start/end/strand/chromosome), e.g. if the data is stored in aGRangesobject.- selectFun
A function that is being called for each entry in the
AnnotationTrackobject with exactly the same arguments as infun. The purpose of this function is to decide for each track element whether details should be drawn, and consequently it has to return a single logical scalar. If the return value isTRUE, details will be drawn for the item; if it isFALSE, the details strip for the item is omitted.- GdObject
Object of class
GdObject.- minBase, maxBase
Numeric scalar, the start and end coordinates of the plotting range.
- prepare
logical. Run the drawing method in preparation rather than in production mode, i.e., only compute the track's layout without rendering anything to the device.
Value
The return value of the constructor function is a new object of
class DetailsAnnotationTrack.
Functions
DetailsAnnotationTrack(): Constructor function forDetailsAnnotationTrack-class.The
DetailsAnnotationTrackclass directly extendsAnnotationTrack. The purpose of this track type is to add an arbitrarily detailed plot section (typically consisting of additional quantitative data) for each range element of anAnnotationTrack. This allows a locus-wide view of annotation elements together with any kind of details per feature or element that may, for instance, provide insight on how some complex quantitative measurements change according to their position in a locus. If the quantitative data is too complex for aDataTrack, e.g. because it requires extra space or a trellis-like representation, aDetailsAnnotationTrackcan be used instead. Example: anAnnotationTrackshows the positions of a number of probes from a microarray, and you want a histogram of the signal intensity distribution derived from all samples at each of these probe locations. Another example usage would be to show, for each element of anAnnotationTrack, an xy-plot of the signal against some clinical measurement such as blood pressure. The limitation for applications of this type of track is basically only the available space of the device you are plotting to.This flexibility is possible by utilizing a simple function model to perform all the detailed plotting. The functionality of this plotting function fun is totally up to the user, and the function environment is prepared in a way that all necessary information about the plotted annotation feature is available. To restrict the details section to only selected number of annotation features one can supply another function
selectFun, which decides for each feature separately whether details are available or not. Finally, an arbitrary number of additional arguments can be passed on to these two function by means of thedetailsFunArgsdisplay parameter. This is expected to be a named list, and all list elements are passed along to the plotting function fun and to the selector functionselectFunas additional named arguments. Please note that some argument names likestart,endoridentifierare reserved and cannot be used in thedetailsFunArgslist. For examples of plotting functions, see the 'Examples' section.initialize(DetailsAnnotationTrack): Initialize thefunandselectFunslots before deferring to theAnnotationTrackinitializer for the remaining slots.drawGD(DetailsAnnotationTrack): plot the object to a graphics device. The return value of this method is the input object, potentially updated during the plotting operation. Internally, there are two modes in which the method can be called. Either in 'prepare' mode, in which case no plotting is done but the object is preprocessed based on the available space, or in 'plotting' mode, in which case the actual graphical output is created. Since subsetting of the object can be potentially costly, this can be switched off in case subsetting has already been performed before or is not necessary.
Slots
funObject of class
function, that is being called for eachAnnotationTrackelement to plot details.selectFunObject of class
function, that is being called for eachAnnotationTrackelement to decide whether details need to be plotted.
Examples
## A minimal plotting function for the details section, drawing the
## feature identifier on a colored background
details <- function(identifier, ...) {
    grid::grid.rect(gp = grid::gpar(fill = "lightblue"))
    grid::grid.text(identifier, gp = grid::gpar(cex = 0.7))
}

## Passing 'fun' to the AnnotationTrack constructor creates a
## DetailsAnnotationTrack instead
dat <- AnnotationTrack(
    start = c(100, 300), width = 50,
    chromosome = "chr1", genome = "hg19",
    id = c("feature 1", "feature 2"), name = "details",
    fun = details
)
plotTracks(dat)